Litecoin's successful retest confirms a robust support level, signaling a shift towards a new macro uptrend.
Analyst RektCapital's earlier observations align with LTC's positive trajectory, emphasizing the cryptocurrency's resilience and market potential.
Despite a recent breakout, LINK struggles with resistance at $106, signaling a shift in market momentum.
- Litecoin’s successful retest confirms a robust support level, signaling a shift towards a new macro uptrend.
- Analyst RektCapital’s earlier observations align with LTC’s positive trajectory, emphasizing the cryptocurrency’s resilience and market potential.
- Despite a recent breakout, LINK struggles with resistance at $106, signaling a shift in market momentum.
Analyst RektCapital shed light on Litecoin’s strategic move to challenge its longstanding macro downtrend, aiming to initiate a transformative uptrend. Litecoin has accomplished a key milestone by successfully retesting its multi-year downtrend, establishing it as robust support on the weekly timeframe. This crucial technical step solidifies the foundation for a promising Macro Uptrend.
Transitioning from a bearish trajectory, Litecoin’s retest signifies a significant turning point for the cryptocurrency. The confirmation of the macro uptrend introduces a fresh dynamic to Litecoin’s market outlook, offering traders new opportunities in a shifting landscape.
As of this writing, Litecoin is exchanging hands at $97.60, up by over 2 percent in the past 24 hours. LTC had consolidated around the $90 level over the past week before breaking up on the upper side to face stiff resistance at $106. Currently, LTC has breached below the $100 key mark as bears and bulls battle for control.
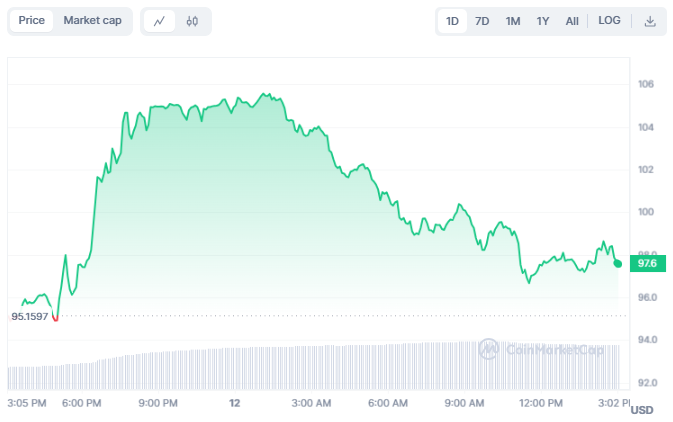
Over the past 7 days, LTC has recorded an increase of 9% while the monthly gain remains at 35%. The market capitalization and daily trading volume have also increased, climbing to $7.25 billion and $1.56 billion, respectively. The increase in the daily trading volume aligns with LTC’s current market momentum as buying pressure increases.
Technical indicators on the daily chart suggest a bullish momentum, losing momentum as the bears persist. The Moving Average Convergence Divergence (MACD) is losing its positive picture as the green bars on the histogram fade away. Despite the trend reversal, the MACD line is still above the signal line.
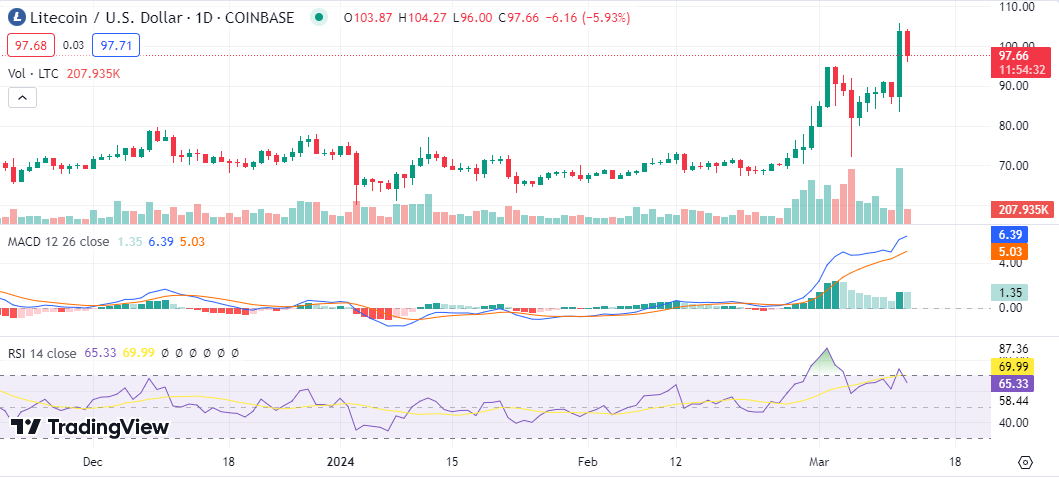
LTC/USD chart: TradingView
The Relative Strength Index (RSI) shifted its upward journey yesterday, and it has been trending downwards, currently hovering around the 65 index. Should the bears hold their ground tight, the RSI could drop to the neutral region, pushing the price further downwards.