
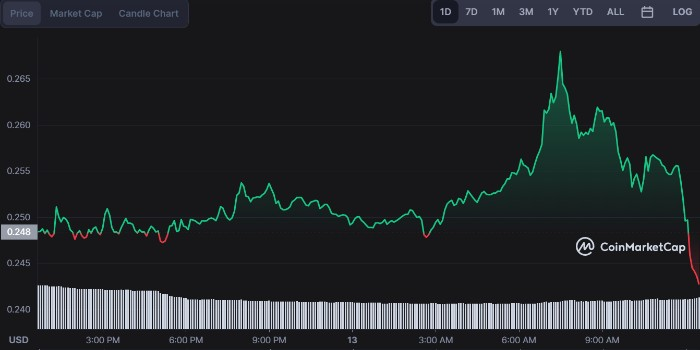
The crypto market has been volatile recently, with many coins seeing sharp price declines after important milestones or key technical rejections. One such coin is Loopring, which saw a sharp decline after hitting an intra-day high of $0.268. The decline was accentuated by bearish divergence on the RSI, suggesting that further downward momentum could be possible in the short term. However, LRC managed to find some support at around $0.204.
The Fibonacci retracement levels indicate that LRC could see further downside in the near term, with strong resistance seen at $0.204 and $0.168. However, if the coin manages to break above this resistance level, it could signal a reversal in trend and renewed bullish momentum in the medium to long term.
Bears heighten their grip against Loopring
LRC is currently trading at around $0.243 after shedding 2.47% in the last 24 hours. A strong selling action was seen yesterday at the $0.268 level where a firm rejection was witnessed. The crypto coin continues to trade in the bearish zone with its medium-term trend still in favor of sellers.
LRC technical indicators are pointing towards further bears’ strength. The Parabolic SAR indicator is hovering below the price candles and remains strongly bearish. The Chaikin Money Flow tool indicates heavy selling action in the market.
Despite this, LRC has managed to find some support near the $0.204 level as bears failed to break it down. On looking at the RSI scale, a double-top pattern is forming which is a bearish sign.
On the 4-hour chart, bearish candlesticks are engulfing bullish ones. However, price candles have crossed below the 20 and 50-day EMA support and this is a bearish sign as well.

The moving average lines are all sloping down indicating strong resistance at the current levels. The key support and resistance level for LRC remains unchanged at $0.204 and $0.268 respectively, while traders need to keep an eye out on the RSI momentum as well. The Simple Moving Average (SMA) has also crossed over the signal line which is a bearish sign.
Overall, LRC seems to be under bearish pressure in the short term but it will take some time for bears to completely overpower bulls on this one.