A recent analysis shared by a renowned crypto analyst, KALEO, has brought the AVAX/BTC pairing into the spotlight, as the chart reveals intriguing signals that may hint at the future price trajectory.
The chart analysis presented by KALEO, a widely followed figure in the crypto analysis community, depicts a pronounced downtrend in the AVAX/BTC price. However, KALEO identifies a whisper of change in the subtle interplay of price action and recent chart patterns.
KALEO has highlighted a descending trendline that has consistently capped the rallies of AVAX against BTC. This bearish structure has led to lower highs, which is typically a sign of bearish sentiment. However, in the world of technical analysis, such persistence can often precede a sharp reversal, and this is where KALEO’s insights become particularly compelling.
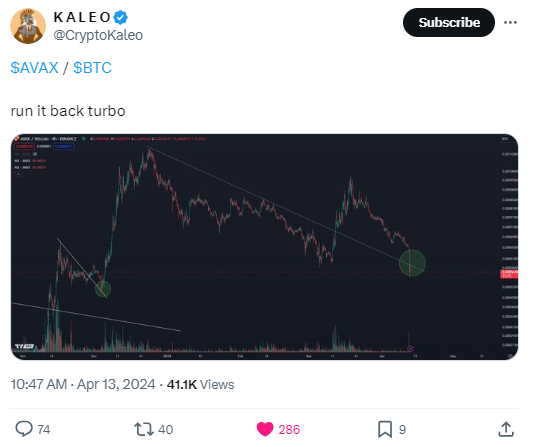
The analyst has highlighted a region of interest where the descending trendline meets the current price. It coincides with a support level that, if respected, could serve as a springboard for a bullish reversal. KALEO has noted this by saying, “Run it back, turbo,” suggesting anticipation of a repeat performance, a rally similar to one seen previously in the chart’s history.
Looking at AVAX/BTC’s technical analysis, the pair exhibits a bearish trend. Most of the technical indicators such as Relative Strength Index (RSI) and Moving Average Convergence Divergence (MACD) are trending in the negative territory.
The Relative Strength Index is hovering in the oversold region suggesting a strong bearish momentum in the pair. However, it has started climbing upwards suggesting a shift in market dynamics as buying pressure increases.
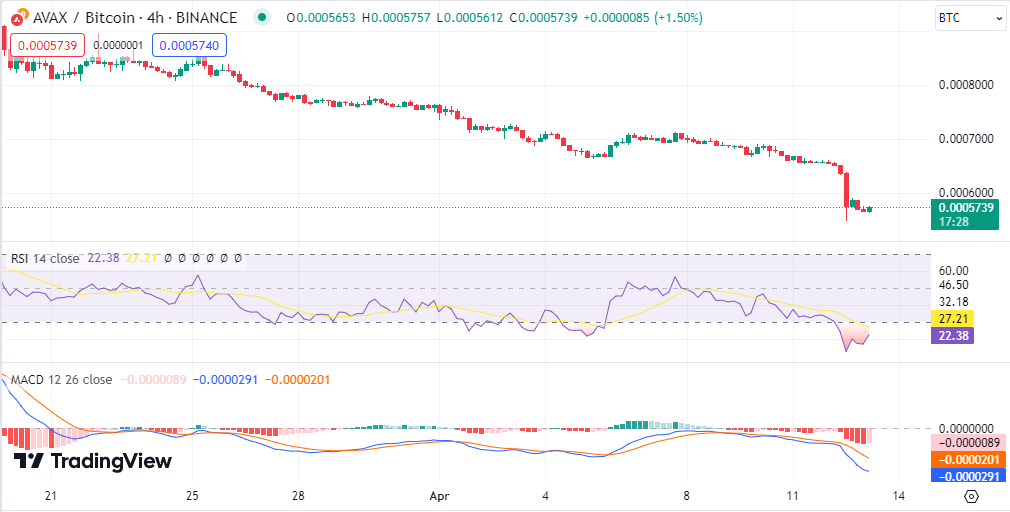
In addition, the Moving Average Convergence Divergence is currently below the zeroline as the MACD line continues to dip further below the signal line indicating a strong bearish trend. Further, the histogram is presenting a bearish trend as the red bars rule the chart. However, a series of green candlesticks have been observed forming on the price chart suggesting an increase in buying pressure.