
Solana has emerged as a token of significant interest among traders and market analysts. A recent analysis by Daan Crypto, a renowned figure in the crypto trading community, sheds light on the intricate movements of Solana’s price over the past week. According to his insights, Solana’s market behavior has been marked by strategic price levels that have played out impressively, presenting challenges and opportunities for investors.
The token’s price experienced a sharp rebound after momentarily dipping into the $75-80 region, demonstrating the market’s quick response to favorable buying zones. This swift bounce back not only underscores Solana’s volatile nature but also highlights the keen interest of the trading community in capitalizing on these fluctuations.
Daan Crypto elaborates on his trading experience, noting the premature closure of a small position that missed the chance to capitalize on long-term gains near the identified ‘green zone.’ This admission sheds light on the nuanced strategy required to navigate the Solana market successfully, emphasizing the importance of timing and patience.
The analysis points to several key levels that traders should monitor. A potential retreat to the $75 level is depicted as an attractive entry point for investors, suggesting confidence in the token’s ability to rally. Moreover, the analysis identifies a significant resistance zone between $138-148, indicating these levels as crucial for determining Solana’s future price trajectory.
Solana’s market trajectory has shown impressive growth recently, with its value ascending to $97.85, reflecting a 0.73% increase in the last 24 hours. This upward trend is bolstered by a surge in trading volume, which has reached $2.88 billion, illustrating heightened market activity. Ranked fifth by CoinMarketCap, Solana’s market cap now stands at a robust $42 billion, highlighting its significant position in cryptocurrency.
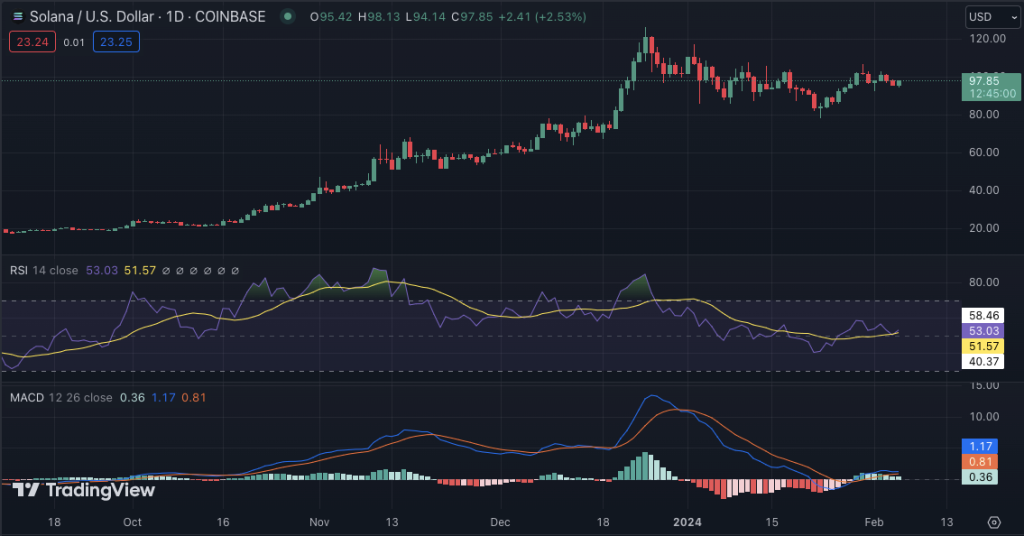
Technical analyses further amplify the bullish outlook for Solana. The Moving Average Convergence Divergence (MACD) indicator signals a positive momentum as it crosses above the signal line. Concurrently, the Relative Strength Index (RSI) nears the 50 mark, indicating a potential bullish trend in the near term. Moreover, the positioning of the 20 Exponential Moving Average (EMA) over the 50-EMA suggests further gains could be on the horizon, painting an optimistic future for Solana’s market performance.