Uniswap, a decentralized finance (DeFi) platform, is currently undergoing a strategic retracement in its market value. This move is a tactical step, with the platform’s value aiming to retest crucial support levels at $6.96 or $6.53. Analysts view this development as a consolidation phase, essential for Uniswap to secure its position before potentially resuming its recently initiated macro uptrend.
Rekt Capital, a crypto trader and analyst, shared insights on an X post, providing insights regarding UNI’s recent market movements.
Uniswap has been trading in a bullish trend over the past week, with UNI rallying above the $7:30 level. This increase, exceeding 2%, symbolizes a robust phase of buying and growing confidence among investors. Despite this upward trajectory, today’s market analysis reveals a contrasting bearish trend for the altcoin. The cryptocurrency is trading at $7.33 at the reporting time, reflecting a 24-hour decline of about 3%.
Over the last week, Uniswap has seen an influx in trading volume, pointing to renewed enthusiasm and involvement around the token. The trading volume for this altcoin has reached a remarkable $137 million, marking a 24-hour increase of 33%. Moreover, Uniswap’s market capitalization has steadily climbed, now standing over $4.38 billion, securing its position among the top 20 cryptocurrencies by market capitalization.
The resistance levels at $7.50 and $8.00 are critical for UNI’s potential breakout from the descending triangle pattern. Should the bulls maintain their current momentum, reaching the $10 mark is a feasible target for UNI. Conversely, if the bearish trend continues, UNI could face a significant fallback to its support levels. Despite these fluctuations, the general market sentiment remains optimistic, with predictions favoring continued positive price movements for UNI in the upcoming weeks.
The daily technical chart for Uniswap also shows bullish indications. The 20-EMA (Exponential Moving Average) has crossed above the 50-EMA, suggesting a potential reversal to a bullish trend. However, the RSI (Relative Strength Index) currently stands in the neutral zone at 58.62, edging towards overbought territory. Additionally, the Chaikin Money Flow indicator is positive at 0.02, signifying strong buying pressure.
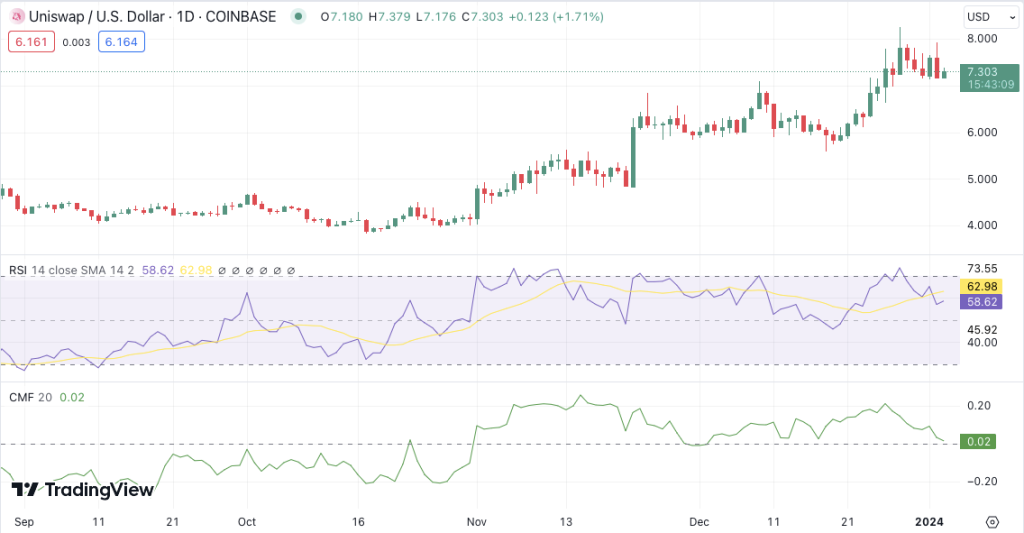
UNI/USD daily price chart, Source: TradingView
As reflected by 15 indicators like moving averages and oscillators, the neutral to bullish market sentiment is cautiously optimistic. This is evident from the mixed signals: 1 indicator suggests a selling position, 1 remains neutral, and 13 favor buying. The oscillators, which include 11 different types, show a similar pattern, with 1 suggesting sell, 9 neutral, and 1 indicating buy signals.