
Pancakeswap price trades lower despite $28M coin burns. The U.S. equities lose traction with mild negative bias.
- Pancakeswap turns hostile on the first trading day of the new week.
- The price took support around the 21-day and 50-day SMA crossover on the 4-hour chart
- A daily candlestick above $3.50 would tilt the bias in favor of bulls. The longer trend remains the downside.
The Pancakeswap price analysis on Monday dictates a sideways trend with a mild negative bias. On the weekend, the token made an impressive recovery from the low of $3.12 and tested a high of $3.48. But, here the bulls could not sustain the gains further.
As of writing, CAKE/USD is exchanging hands at $3.43, down 0.34% for the day. The 24-hour trading volume dropped nearly 8% to $25,698,034. A fall in price along with a declining volume suggests the bearish momentum is not that strong.

Pancakeswap trades with not much effect despite the $23 million worth of tokens just burned. The decentralized exchange’s native token burnt 6.78 million tokens with the mentioned equivalent value.
Pancakeswap trades near the critical juncture
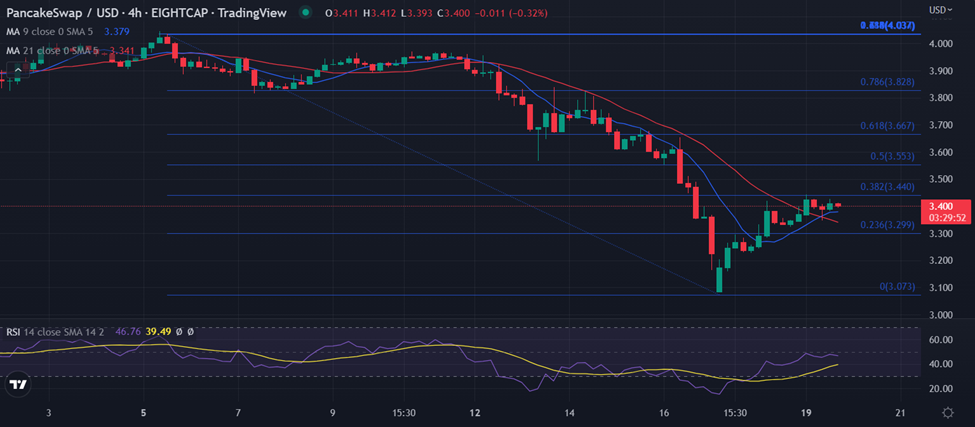
On the 4-hour chart, the Pancakeswap price analysis looks near the key resistance level. The token picks up the momentum above the crucial 9-day and 21-day simple moving average (SMA). But the formation of the Doji candlestick indicates indecision among investors.
Pancakeswap has lost almost 26% from its high of $4.03. Currently, the price paused the gains near the 38.2% Fibonacci retracement level, which is a critical resistance zone.
A trade below $3.40 would mean the continuation of the downside movement and the price could test the $3.30 mark. Further, sustained selling pressure could drag the price toward $3.10.
On the flip side, a shift in the bearish sentiment and a daily close above $3.50 would turn the tide in the favor of buyers. If that occurs, the first upside target could be found around the 0.50% Fibonacci retracement at $3.55.
Next, the market participant would aim for the horizontal resistance zone at $3.70.
Technical indicator: RSI: The 4-hourly RSI trades sideways below 50. This indicates a sideways movement for the current price action. Any downtick in the oscillator will see a correction in the price.