
According to Ali, a renowned crypto analyst, PEPE is showing promising signs of growth. He identified a key pattern in the market behavior of PEPE. The cryptocurrency formed the right shoulder of a head-and-shoulders pattern on its 3-day chart. This observation is crucial for investors as such patterns often indicate upcoming changes in price movements.
Moreover, the TD Sequential indicator complemented Ali’s findings by issuing a buy signal within the same timeframe. This added a layer of confirmation to the anticipated bullish trend for PEPE. The convergence of these technical indicators suggests that PEPE could first reach a price point of $0.00000166. Following this initial surge, a further increase to $0.00000274 seems plausible.
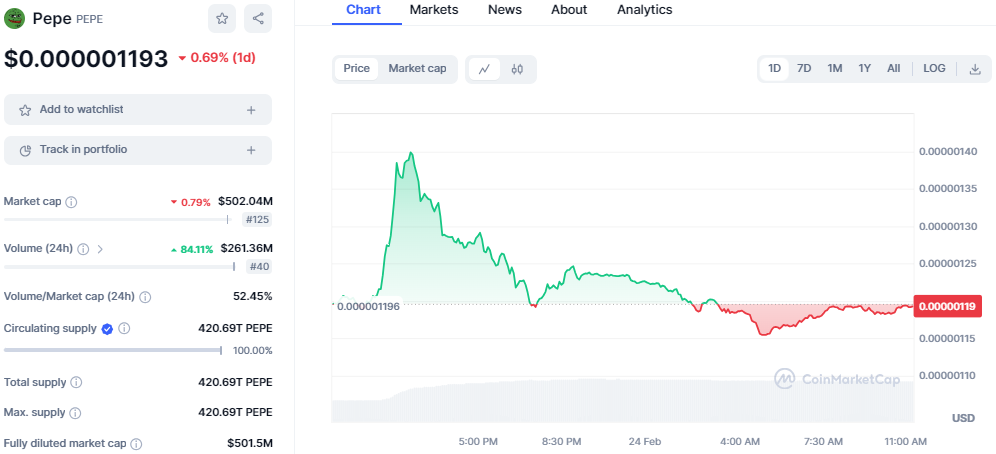
Currently, PEPE has encountered a downturn, moving away from its previously upward momentum. Today’s trading session saw the PEPE token initiate at $0.000001197, only to trend lower as the day progressed. Despite the token’s attempt to maintain its gains, bearish forces have intensified, suggesting a potential retreat toward the support level of $0.00000110. As of this writing, PEPE is exchanging hands at $0.000001193, down by 0.69% in the past 24 hours.
Resistance at the $0.00000140 mark is a formidable barrier, thwarting significant upward movements. The persistence of this resistance level could lead to further declines for the token in the short term.
However, the trading volume for PEPE has seen a significant uptick, indicating a growing market interest despite the downward price action. This increased activity could exacerbate the token’s bearish momentum with a 24-hour trading volume of approximately $261 million. Moreover, the token’s market capitalization mirrors this downtrend, currently valued at around $502 million.
Technical indicators, including the MACD and RSI, lean towards a bearish outlook. The MACD’s downward trajectory and position below the signal line underscore the potential for continued losses. Meanwhile, the RSI hovers in the neutral zone at 56.64, possibly dipping into oversold territory if the bearish trend persists.
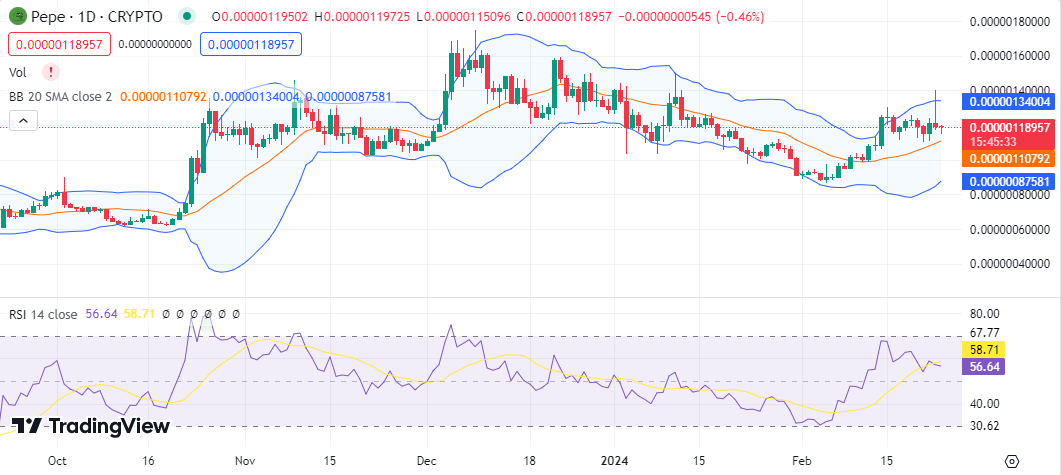
The Bollinger Bands on the PEPE chart suggest an approaching period of reduced volatility, with both upper and lower bands trending downward. This convergence indicates that while strong resistance caps gains at $0.000001340, a robust support level awaits at $0.0000008757, possibly cushioning further declines.