PI Holds Near $0.18 as Bearish Pressure Meets Oversold Signs
- The PI token trades near $0.18 as wider market pressure drives sharper losses
- Heavy token unlocks and weak liquidity keep the PI token stuck in a fragile setup
- RSI shows deep oversold levels, yet sellers still dominate near key barriers
The PI token slid again, holding near $0.1837 at press time after another mild dip over the past day. The move extends a bruising stretch for the token, which is now down by 11% on the week and roughly 90% from last year’s levels. The decline mirrors an uneasy mood across the wider market, where risk appetite has thinned, and smaller altcoins have struggled to find buyers.
The tone has grown heavier in recent sessions. Outflows from U.S. spot Bitcoin ETFs, paired with shifting expectations for Federal Reserve policy, have tightened conditions across the board. Even sturdier assets felt the pullback, leaving higher-risk names such as PI more exposed to abrupt selling.
Broader Pressure Spills Into Smaller Caps
Total crypto market capitalization slipped about 0.87% in 24 hours, enough to reinforce the sense that sentiment has tilted defensive. Similarly, Bitcoin’s move lower followed ETF withdrawals of roughly $1.22 billion in a week, a figure that caught attention and stirred talk of investors seeking steadier ground.
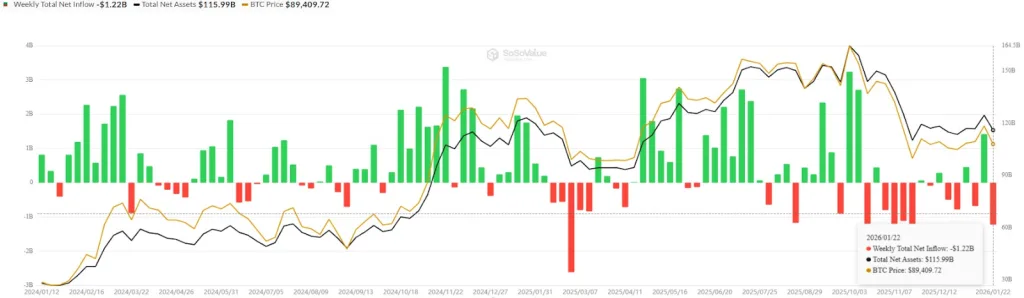
Source: SoSoValue
Strong GDP data added to the mix by softening hopes for quick rate cuts, giving traders one more reason to ease off exposure. A look at the Fear and Greed Index, sitting at 34, reflected that caution.
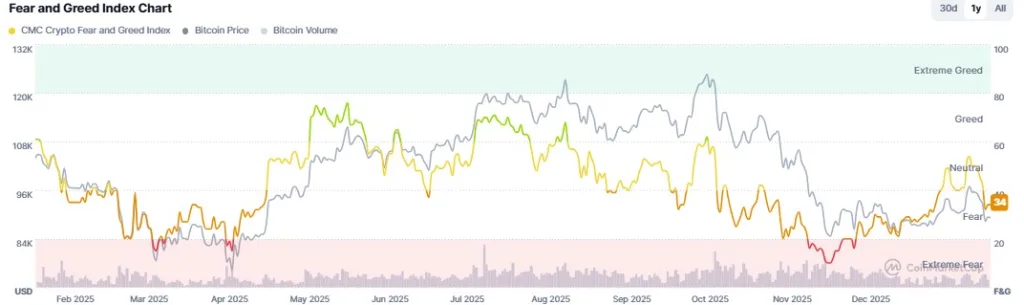
Source: CoinMarketCap
Conditions like this often widen the gap between major tokens and thinner altcoins. PI’s tight liquidity leaves little room for error, and even modest trades can push prices farther than expected.
Structural Friction Persists in the PI Ecosystem
Away from macro forces, PI faces long-running issues inside its ecosystem. More than 1.2 billion tokens are scheduled to unlock in the next year, an overhang that continues to shadow price action. On the other hand, demand has not risen at the same pace, leaving supply growth to do most of the talking.

Source: PiScan
Notably, market access remains narrow. PI is still absent from tier-one exchanges, keeping liquidity shallow and limiting participation. That limited reach, combined with the large supply controlled by the Pi Foundation, has raised ongoing questions about concentration.
Updates such as the recent Pi App Studio rollout were noted, but the market reacted little, with structural concerns continuing to dominate the conversation.
Technical Picture Offers a Brief Pause, but Not Relief
On the chart, PI touched a record low of $0.15 earlier in the week before bouncing. A double bottom appeared around that zone, helped by a hammer-shaped candle that signaled some resistance to further selling. However, the relief was short and tentative.
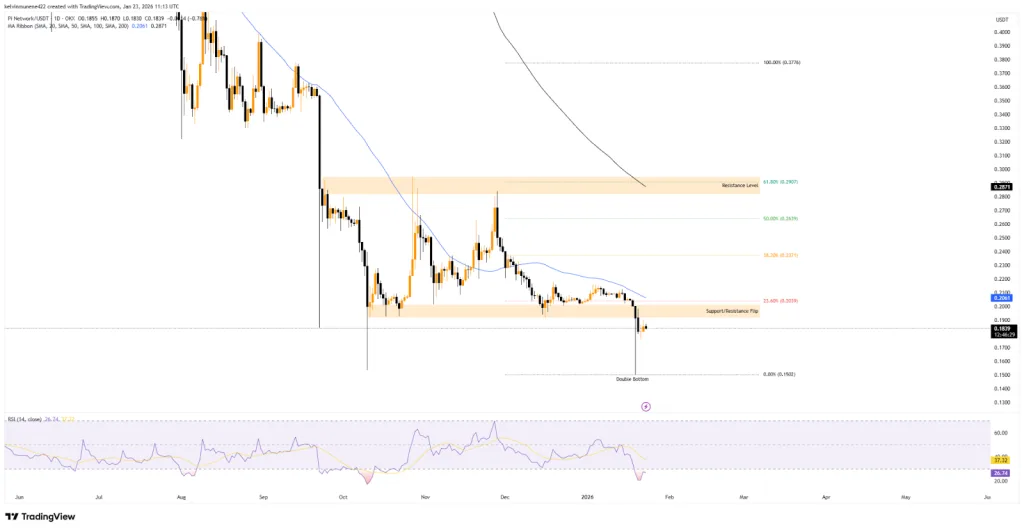
Source: TradingView
The price is now drifting toward a familiar barrier at $0.19 to $0.20, a former support shelf that flipped into resistance after December’s breakdown. Moreover, its position near the 23.60% Fibonacci mark only strengthens the level’s influence. Unless the token pushes cleanly through that range, the broader downtrend remains intact.
Not to leave out, PI continues to trade beneath all major moving averages, and the Supertrend signal still tilts negative. None of these points point to a firm recovery. Thus, a revisit of the prior low near $0.15 sits within reach if sellers regain momentum.
Related: SAND Price Jumps 11% as Two-Week Bullish Streak Extends
Momentum Gauges Highlight Room to Move
The one counterweight, however, is the Relative Strength Index, now hovering around 26. That reading reflects heavy selling rather than renewed strength, but it does suggest space for short-term rotation if buyers reappear.
For any meaningful recovery, PI would need to reclaim the $0.19-$0.20 band, stabilize, and then work toward higher levels at $0.23 and $0.26. For now, sentiment remains cautious, supply pressure lingers, and the burden rests on the chart to show that sellers have finally exhausted their advantage.