
Polkadot is currently at a critical juncture, according to insights from well-known cryptocurrency analyst and trader Crypto Tony. In a recent X post, he emphasized that Polkadot’s price is testing a significant resistance zone at $7.30. He advised potential investors and current holders to wait for the digital currency to surpass this threshold before considering any long positions.
This strategy suggests that breaking above the $7.30 mark could signal a strong bullish trend, making it a potentially lucrative entry point for traders. However, as it stands, the price is hovering around this key resistance level. Crypto Tony advises caution, indicating that jumping in too early could lead to investment decisions.
Polkadot has been capturing attention with its impressive performance in the cryptocurrency market. Recently, it embarked on an upward trajectory within a rising parallel channel initiated last week, gaining momentum, particularly after Bitcoin broke past the notable $50k resistance level, a peak not seen since 2021. As of the latest update, Polkadot is trading at $7.40, marking a significant 24-hour increase of 4.58%.
This past week, Polkadot has emerged as the market’s standout performer, recording an increase of over 10% and showcasing its bullish momentum by oscillating between $6.65 and $7.45. This trend is underscored by a substantial rise in trading volume, hitting $659 million and cementing DOT’s status as the second-largest cryptocurrency by market capitalization, currently at $9.44 billion.
The daily technical analysis reveals a promising outlook for Polkadot. The Relative Strength Index (RSI) is at 59, indicating a strong foothold for buyers just above the neutral territory. The daily chart presents a positive trajectory, especially after Polkadot broke above its 200-day moving average, escaping a notable descending channel.
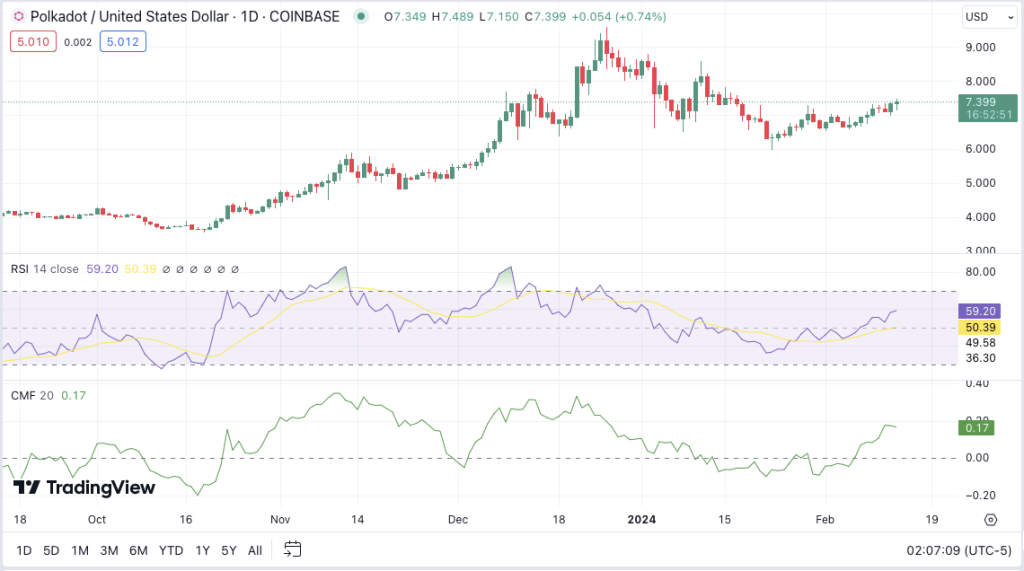
The bullish sentiment is further supported by the Moving Average Convergence Divergence (MACD), with the MACD line’s climb above the signal line highlighting increasing bullish momentum. This is complemented by the 20-day Simple Moving Average (SMA) and the 50-day SMA crossing over the 200-day SMA, alongside the Chaikin Money Flow indicator’s position at 0.17 in the positive territory, all pointing towards a favorable market outlook for Polkadot.