
Polkadot is currently experiencing a significant price rebound. This resurgence aligns with Polkadot’s ongoing enhancements, notably integrating advanced AI features and a robust multi-chain architecture. These developments are poised to make Polkadot a more scalable and efficient platform for blockchain technology.
The platform’s innovative, shared multi-chain setup plays a crucial role in alleviating transaction bottlenecks. This structure streamlines processes and significantly improves the efficiency of AI computations on the blockchain. With these upgrades, Polkadot ensures that it remains at the forefront of blockchain technology, catering to increasing demands for AI integration and better performance.
By continuously integrating cutting-edge technology and expanding its capabilities, Polkadot is establishing itself as a versatile and forward-thinking blockchain solution. This makes it an attractive option for developers and investors looking for platforms that offer both reliability and advanced technological integration. The recent updates are expected further to bolster Polkadot’s position in the competitive blockchain market.

According to crypto analyst Michael van de Poppe, Polkadot has entered a low point in its trading cycle against Bitcoin. His latest insights reveal that despite the integration of advanced features and a robust multi-chain architecture suitable for scalable AI applications, DOT is currently experiencing a downtrend in value compared to BTC.
Van de Poppe’s analysis highlights a noticeable decline that began after a peak in early 2021. A consistent downward trajectory has marked the subsequent period. Recent chart data points indicate a possible stabilization at these lower levels; however, it remains to be seen if this will establish a new support base or if the decline will persist.
Over the past 24 hours, Polkadot’s value has declined slightly, trading at $6.71. This represents a 2.58% decrease within a day. The market capitalization mirrors this downward trend, now sitting at approximately $9.65 billion. Polkadot’s trading volume saw a reduction as well, dropping by 8.58% to close around $126.9 million. Despite these shifts, Polkadot maintains its position among the top cryptocurrencies.
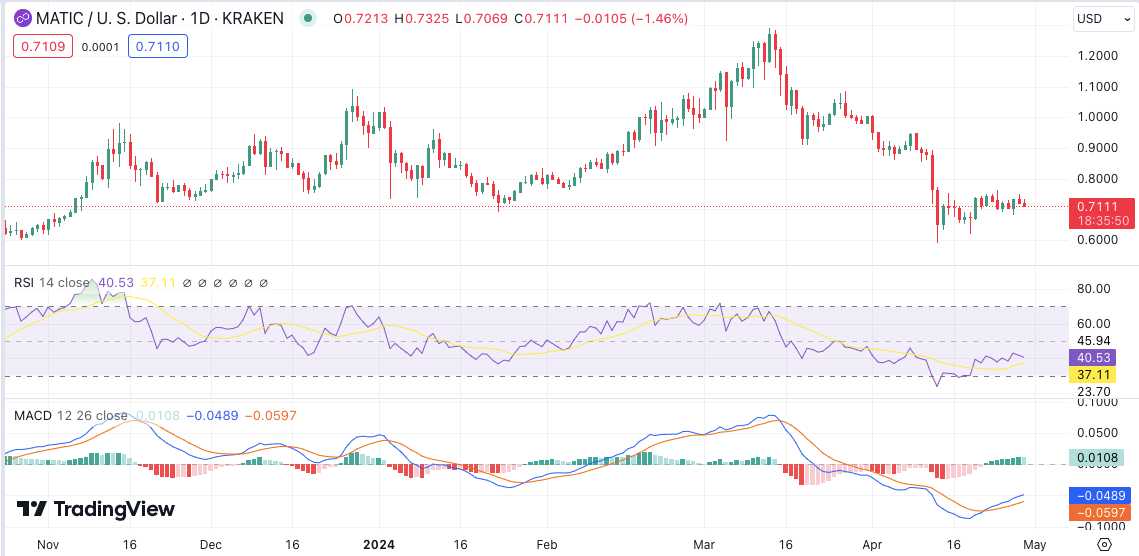
The 24-hour technical indicators for MATIC show a nuanced picture of market movements. The asset experienced slight volatility, registering a marginal decrease. The Relative Strength Index (RSI) suggests a neutral momentum at 40.53, hovering around the mid-range. The Moving Average Convergence Divergence (MACD) presents a subtle bearish signal, with the histogram indicating a negative trend.


