


- Sei’s breakout target is $0.9088, signaling a potential 174.16% increase from current levels.
- Key support at $0.45 and resistance at $0.60 are crucial for confirming a bullish reversal in Sei’s price action.
- At press time, RSI of 51.12 and MACD above the signal line indicate neutral momentum with a potential bullish signal.
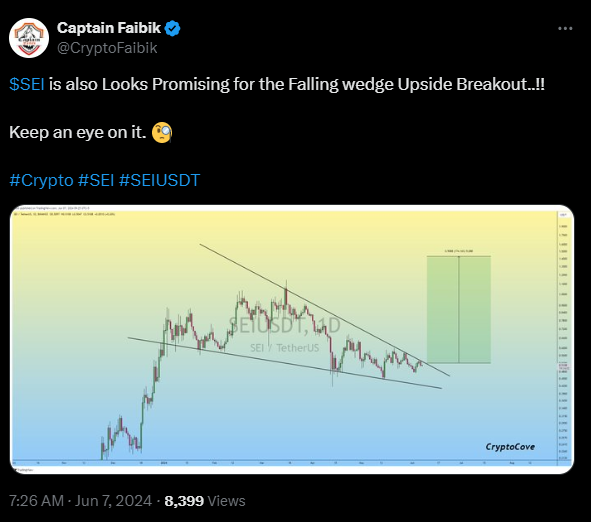
The Sei (SEI/USDT) cryptocurrency is exhibiting a promising setup for a potential upside breakout, as observed in the daily timeframe chart. As highlighted by Captain Faibik, an analyst, the price pattern forming on the chart is a descending wedge, typically considered a bullish reversal pattern. This setup suggests a possible significant upward movement for Sei in the near future.
The descending wedge pattern is characterized by two converging trendlines: a descending resistance line and a descending support line. The price action within the wedge is narrowing as it approaches the apex, indicating a potential breakout. Key support and resistance levels are critical in this analysis.
The support level is around $0.45, marking the lower boundary of the wedge. Historically, this area has seen substantial buying interest. On the other hand, the resistance level is at the upper boundary of the wedge, currently around $0.60. For a bullish reversal to be confirmed, the price must break through this resistance level.
JasmyCoin ( JASMY ) Bulls Dominate with 2x Surge Post-Pennant BreakoutThe breakout target from the descending wedge is projected by measuring the height of the wedge at its widest part and extending that distance from the breakout point. In Sei’s case, the breakout target is approximately $0.9088. This target represents a potential 174.16% increase from the current price level, indicating significant upside potential if the breakout materializes.
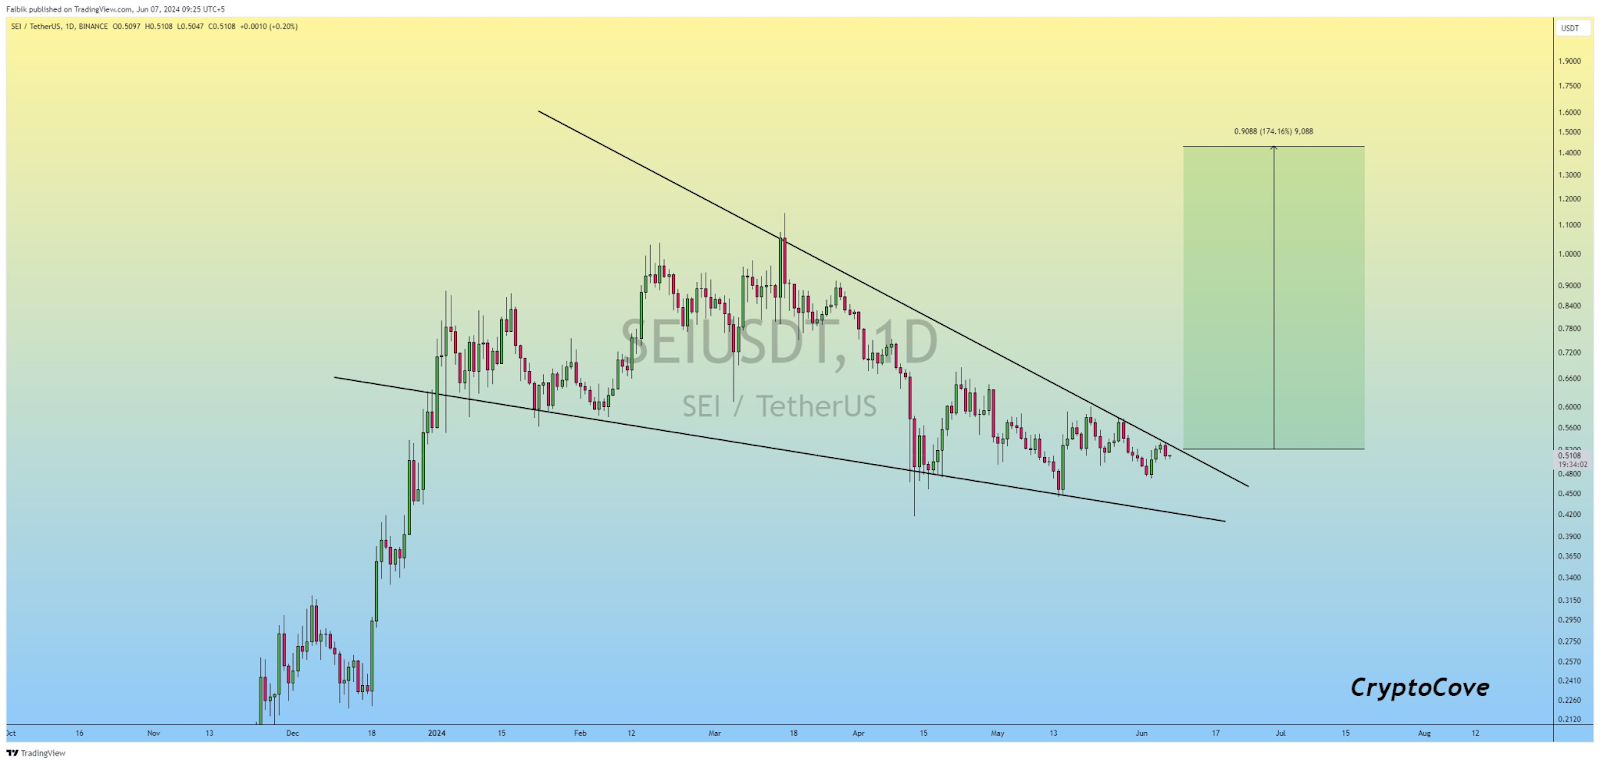
A breakout above the descending resistance line would signal a bullish reversal and a potential move towards the $0.9088 target. However, if the price fails to break out and falls below the support line, the bullish setup could be invalidated, leading to further downside.
The current market conditions support this potential breakout scenario. The live Sei price today is $0.534788, with a 24-hour trading volume of $79,625,502. Sei has experienced a 2.91% increase in the last 24 hours.
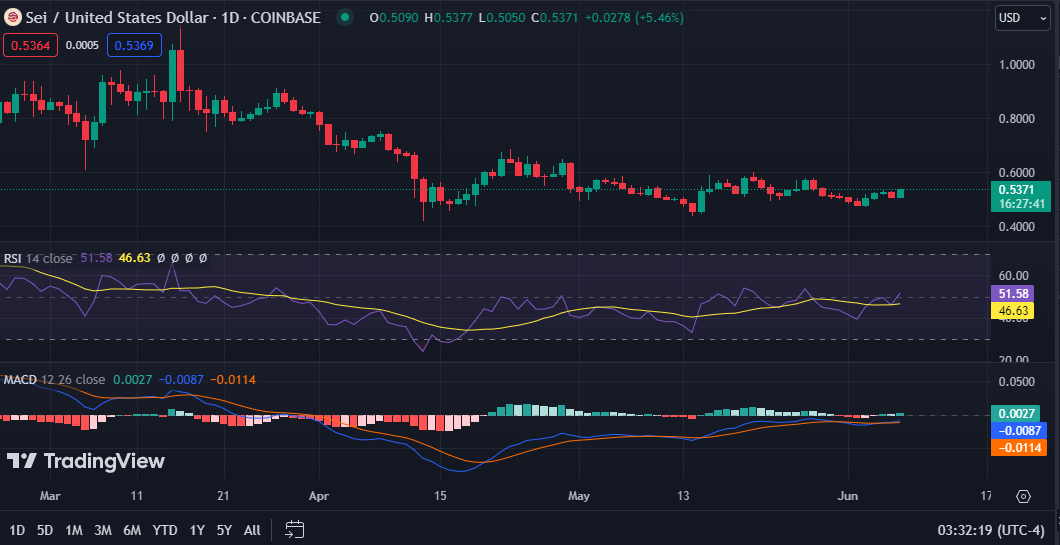
The 1-day Relative Strength Index (RSI) reads 51.58, indicating that the stock is neither overbought nor oversold. This neutral stance suggests balanced short-term momentum. Moreover, the 1-day Moving Average Convergence Divergence (MACD) is trading above the signal line, indicating a potential bullish signal.


