SEI Slides to 7-Month Support as Analysts See a 400% Jump to $0.70

- SEI revisits the $0.15–$0.13 support zone that fueled a major rebound earlier this year.
- Analysts highlight Fibonacci targets at $0.25, $0.33, and $0.70 with a 400% upside.
- Spot flows show steady exchange outflows as holders shift SEI into long-term storage.
Sei’s native token, SEI, is back at a price zone last seen seven months ago after an extended 4-month decline cut its value by more than 50%. The token’s retreat comes during a wider market downturn that drove Bitcoin to an $82k low, pushed Ethereum to the $2,700 range, and erased 7% from the global crypto market cap, bringing the total to $2.91 trillion.
Despite the negative backdrop, analysts say SEI has reached a level that previously sparked a major rebound, placing fresh attention on whether the support can hold under current market pressure.
According to SEI’s technical analysis, the token dropped back into the $0.15–$0.13 band this week, the same region that fueled an estimated 200% surge earlier in the year. As of press time, SEI has fallen 11% in the last 24 hours, mirroring the anxiety sweeping across digital assets.
Besides, the Fear and Greed Index now reads 11, reflecting severe risk aversion and reduced trader confidence. The decline places SEI directly on the lowest support zone seen since April. From mid-July to November, the token recorded steady lower highs and lower lows, supporting a long-term downward structure that has dominated its market trajectory for nearly one year.
Analysts Highlight a Potential Reversal Zone
On-chain analyst Ali_charts marked the $0.15–$0.13 range as a strategic accumulation area, noting in a post that this zone represents the “ideal” level for positioning. The chart he shared shows a descending triangle pattern stretching back nearly two years, with SEI repeatedly failing to break above it.
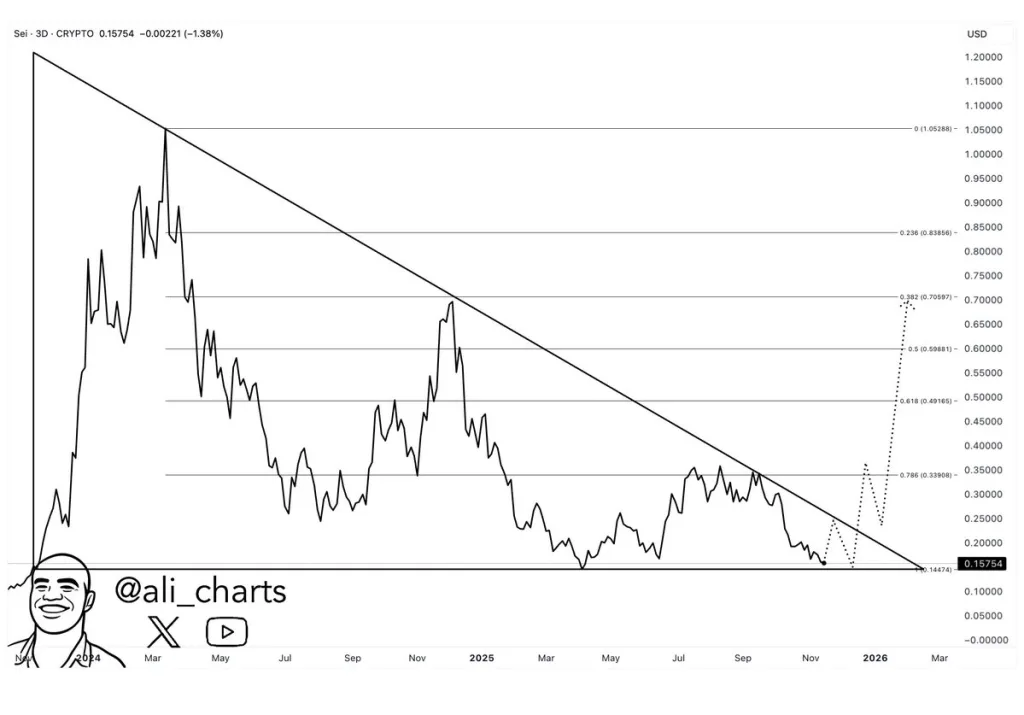
Ali’s model maps three upside checkpoints based on Fibonacci retracement readings:
- Triangle’s descending trendline: around $0.25
- 0.786% level: around $0.33
- 38.2% level (November 2024 high): $0.70
Ali projects a return to the upper target, representing a move of roughly 400% from the lower boundary of the support band. Market analyst Michaël van de Poppe also identified early stabilization signs on the weekly chart.
He noted that early trend reversals “start relatively slow” and pointed to a weekly candle forming along the upper side of the support region. This shift follows the deep wick recorded in October, which marked the strongest downside test of the year.
Still, Van de Poppe observed that the weekly 20-period moving average remains in a downward slope, showing that overall momentum is still weak. Even so, recent candles have flattened, suggesting fading sell-side aggression.
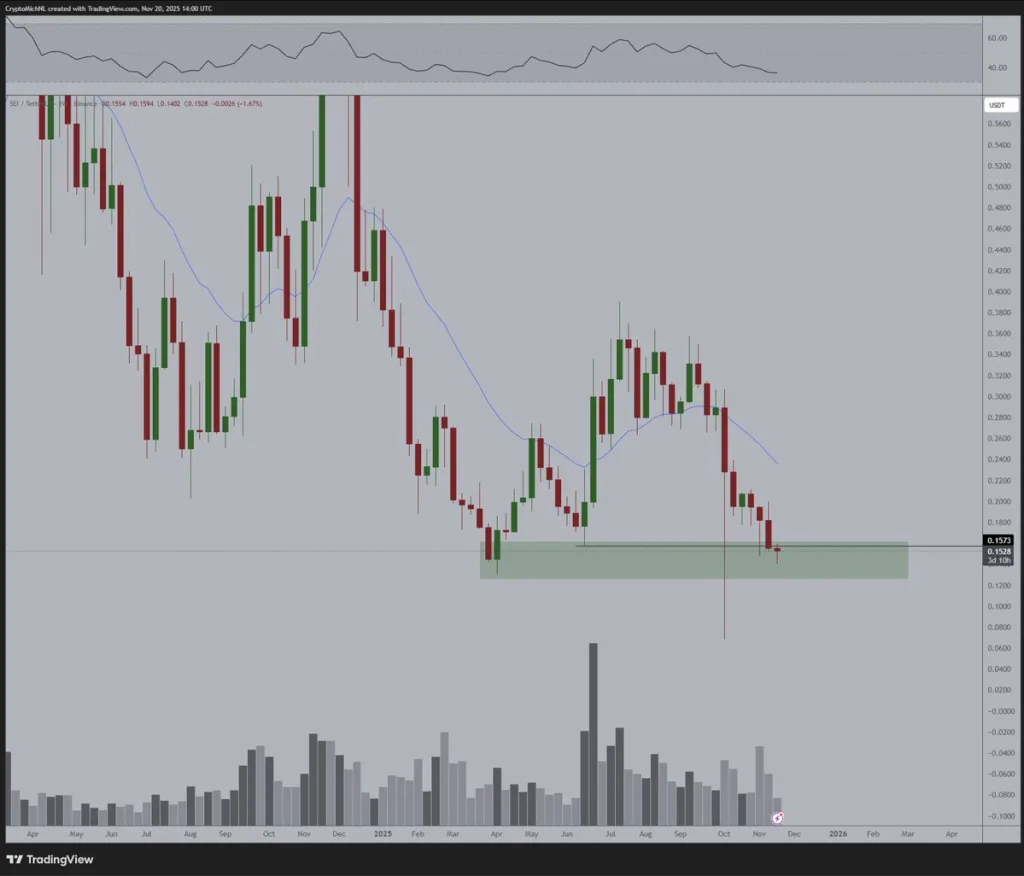
Volume has also normalized since October’s heavy liquidation wave. The RSI sits just above the oversold area, reflecting a market attempting to regain footing after a prolonged decline.
Commenting on the setup, Van de Poppe said he expects SEI to “see a strong move” if the current structure continues to develop. He added that the token has posted “a good weekly candle,” though he emphasized the need for “a follow-up in the coming weeks” to confirm a genuine shift in momentum.
On-Chain Indicators Reveal Mixed Signals
Derivatives data remains soft. SEI’s open interest has fallen sharply to roughly $82 million, down from a Q4 high of $271 million. This contraction highlights reduced speculative activity and a drop in short-term conviction.
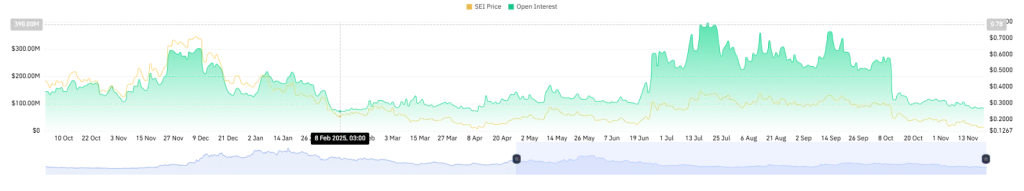
Similarly, trading volumes in derivatives markets continue to move within a tight band, indicating restrained volatility and limited positioning from leveraged traders. The spot market, however, tells a different story. Exchange data shows consistent outflows beginning on November 11, meaning holders are shifting coins to private wallets instead of keeping them on trading platforms.
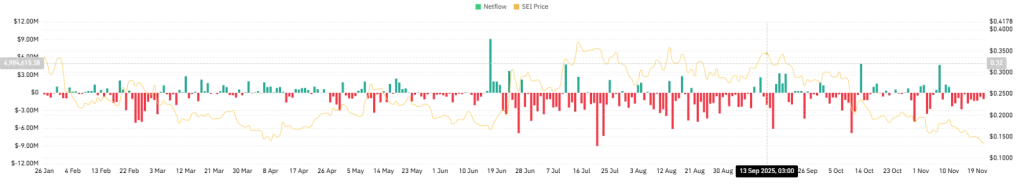
This behavior often reflects accumulation, especially when it appears near key support zones. The pattern suggests long-term participants are maintaining confidence in the project despite short-term selling pressure.
Related: WLFI Breaks Out of Falling Wedge, Positions for 22% Push to $0.17
Market Outlook Hinges on Support Stability
SEI now sits on a support range that previously triggered a strong recovery. Analysts largely agree that the token’s near-term outlook depends on how firmly this level holds. Derivatives activity shows clear caution, yet spot data reveals steady movement toward long-term storage, a contrasting signal in an otherwise fearful market. The next phase of SEI’s trend is likely to hinge on this balance: whether the token can stabilize on familiar ground or extend its decline under heavy market uncertainty.