


- SEI’s breakout from a cup and handle pattern led to a remarkable 222% increase, now trading above the $1 threshold.
- SEI’s impressive 46% weekly surge and break above $1, driven by a surge in trading volume and market cap, showcases strong buyer momentum.
- The technical indicators, including an overbought RSI and bullish MACD, signal a potential for further gains despite the possibility of a correction.
SEI has experienced a significant rally, marking a triumphant ascent in its stock value. Initially spotted trading below $0.2982, the stock showcased a classic cup and handle formation, a bullish signal to keen investors. Consequently, the breakout from this pattern heralded a strong upward momentum. The stock price surged, culminating in an impressive 222% gain from its initial breakout point.
CryptoBusy, a renowned crypto analyst, shared an X post about $SEI’s surge since its breakout from a cup and handle pattern.
Moreover, this bullish trend has propelled the price to break above the $1 mark, a significant milestone for SEI. Investors and market watchers alike have taken note of this remarkable growth, attributing it to solid market fundamentals and investor confidence. Additionally, the surge has sparked interest in SEI’s market positioning and future potential.
As of press time, SEI is exchanging hands slightly below the $1.0 hurdle at $0.9691, an increase of over 6% in the past 24 hours. In today’s session, the bulls have been in complete control, pushing the price from $0.8996 to climb above the $1.0 key level. On the weekly timeframe, SEI has impressively gained 46%, surging from a low of $0.67 to today’s daily high of $1.02.
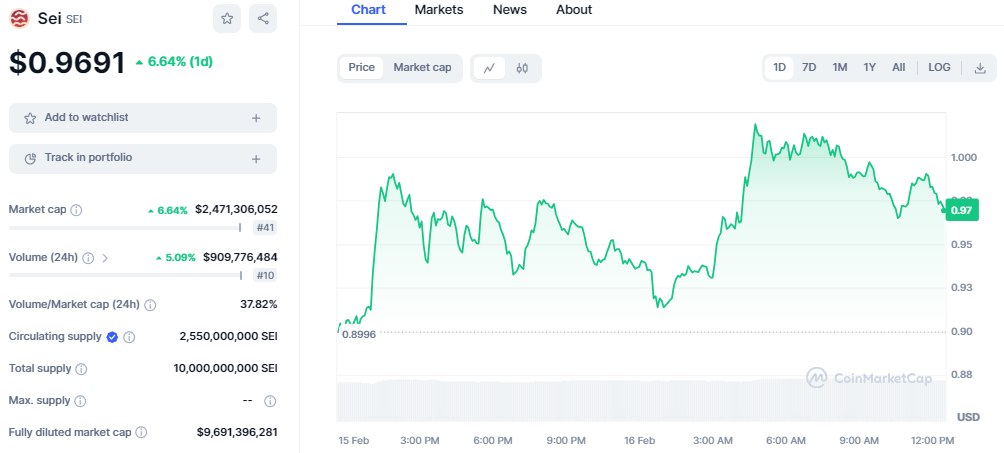
SEI’s bullish outlook has been attributed to the surge in the daily trading volume and market capitalization. The 24-hour trading volume has surged by 5%, climbing to $909 million, while the market capitalization increased to $2.4 billion. This suggests increased buying pressure from buyers, pushing the price higher.
Looking at the technical front, SEI has formed an ascending triangle pattern on the daily chart, with green candlesticks ruling the chart. If the current trend holds, SEI could touch new highs above the $1.0 level. Immediate support has been noted at the $0.8700 mark, while the key support remains at the $0.7500 level.
Technical indicators display a bullish bias as the price continues to form a steady upward trajectory. The Relative Strength Index (RSI) is at an elevated level in the overbought region, which suggests the price could be imminent for a correction if the bulls lose momentum. This rise in RSI indicates the presence of strong buying pressure.
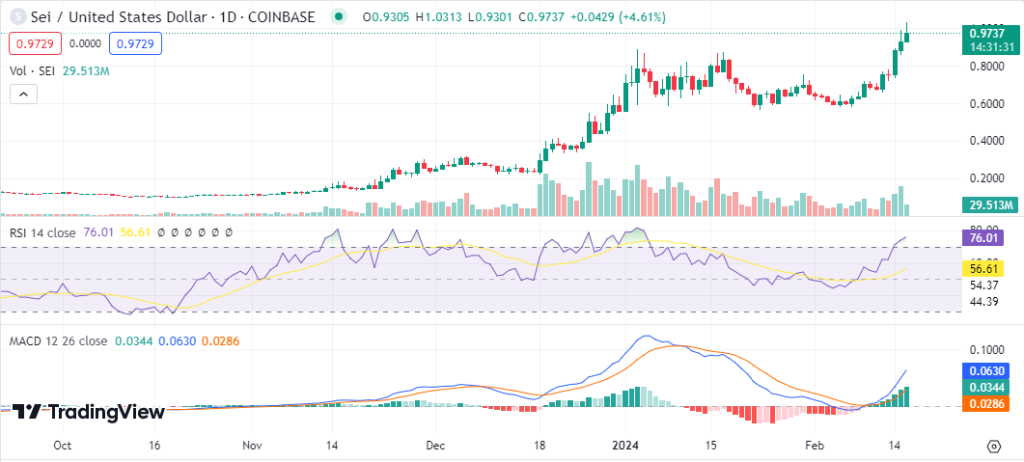
In addition, SEI is sitting above the 10-day simple moving average (SMA) at 0.7625 near the key support, which suggests a buying signal. Finally, the Moving Average Convergence Divergence (MACD) indicator displays a positive outlook as the MACD line climbs further above the signal line. The histogram is positive, too, as green bars rule the chart indicating a strong bullish momentum.


