Today’s Serum price analysis shows that the cryptocurrency has rallied to a high of $0.4758, after a bullish rally that began yesterday. The surge has been attributed to increasing demand from traders and investors who are optimistic about the future of Serum (SRM).
The serum is trading in a range of $0.4373 to $0.5043, as of this writing. However, if bulls are able to break above the resistance at $0.5043, it could signal a further uptrend in prices. And a break below the $0.4373 support level could result in a downward correction.

Other top-performing cryptocurrencies have also seen a similar trend, with Bitcoin and Ethereum being two of the biggest gainers over the past week. At the moment, Serum (SRM) has been showing bullish signs and its price has surged 5.82% over the last 24 hours to reach a high of $0.4758.
The trading volume for SRM/USD has surged significantly in the last 24 hours, indicating that buyers are taking advantage of the bullish trend and buying into this cryptocurrency. Currently, the trading volume is at $393,637,809 and has a market cap of $125,663,797.

The technical outlook of Serum (SRM) on the 1-day chart is bullish and the RSI indicator has already crossed above 70. The MACD line is still trading in the positive zone, as buyers continue to push SRM higher. The 50-day moving average is currently at $0.45 and the 200-day moving average is at $0.39, providing further evidence of a bullish trend.
Looking at the 4-hour chart for SRM/USD, we can see that the price has been trading in an ascending channel and buyers are attempting to push the price further up. However, the selling pressure was seen some hours ago, which pushed the price down. But the buying pressure was strong enough to push the price back up. The current bullish momentum looks promising, and traders should keep a close eye on Serum (SRM) in the coming days.
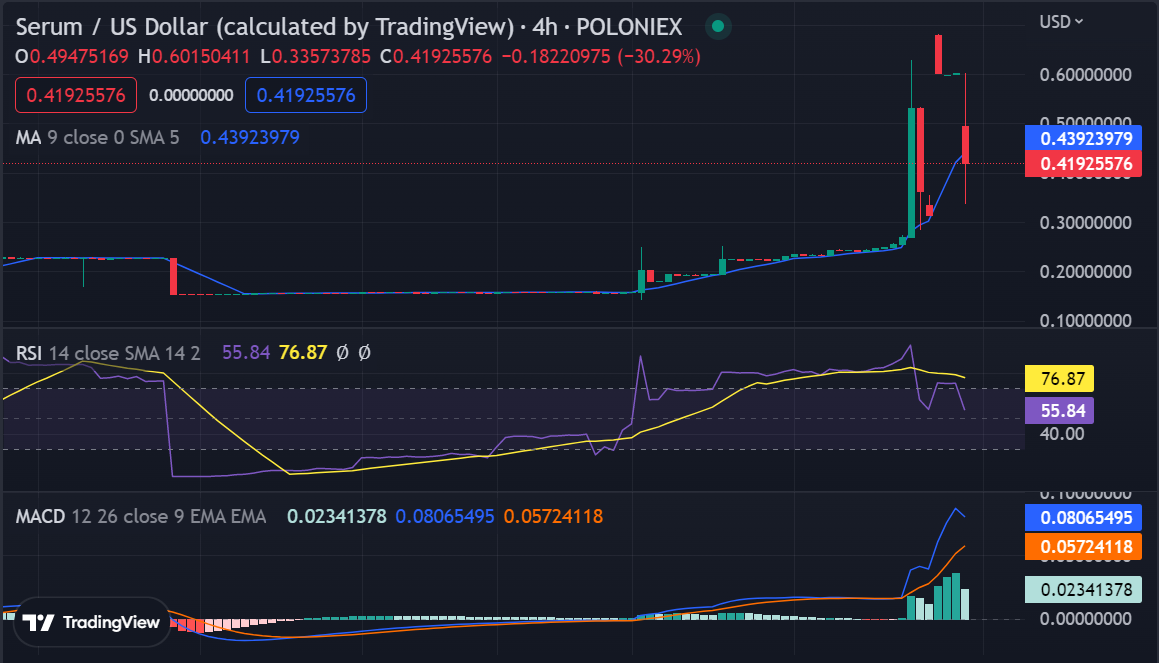
The price trends have been undergoing constant variation for the past week, but now a continuation of the bullish trend can be seen on the price chart, which started yesterday. The moving average (MA) value is found standing at $34.1 position above SMA 50 curve.
The moving average convergence divergence (MACD) indicator is also indicating a bullish trend, as both the MACD line and signal lines are trading in the positive zone. Additionally, The Relative Strength Index (RSI) graph shows a very slight upward curve as more buying activity is taking place in the market, and the RSI level has reached 48.
Overall, the market movements for Serum (SRM) are positive and it looks like the bullish trend will continue in the near future. we expect that the bulls will remain dominant and push the price up to $0.5043 in the coming days.
The surge in Serum also coincides with a bullish Bitcoin (BTC) market sentiment, which has been pushing the prices higher for most digital currencies such as Ethereum (ETH), Litecoin (LTC), and Cardano (ADA). However, it is yet to be seen whether this surge will continue in the days ahead. It is also worth mentioning that Serum is still relatively new, having only launched its mainnet earlier this year.