Global cryptomarket trades mixed amid sell-off in U.S. equity. In the latest data, U.S. House Prices fall for 4th Month
- SHIB consolidates losses above $0.0000080 amid bearish market sentiment.
- The price trades below the 9-day and 21-day moving average crossover on the daily chart.
- A daily candlestick above $0.0000835 could turn the tide in favor of bulls.
Shiba Inu price analysis is modestly negative for the day. However, the long-term trend is still under bearish dominance. The asset is hovering in a very narrow range with a stint of downside movement. As of writing, SHIB/USD is reading at $0.0000082, down 0.86% for the day.
Meanwhile, the trading volumes rose nearly 22% to $68,968,737 in the past 24 hours. An increase in volume with a decreasing price is generally a bearish sign.
Shiba Inu holds near the critical support zone
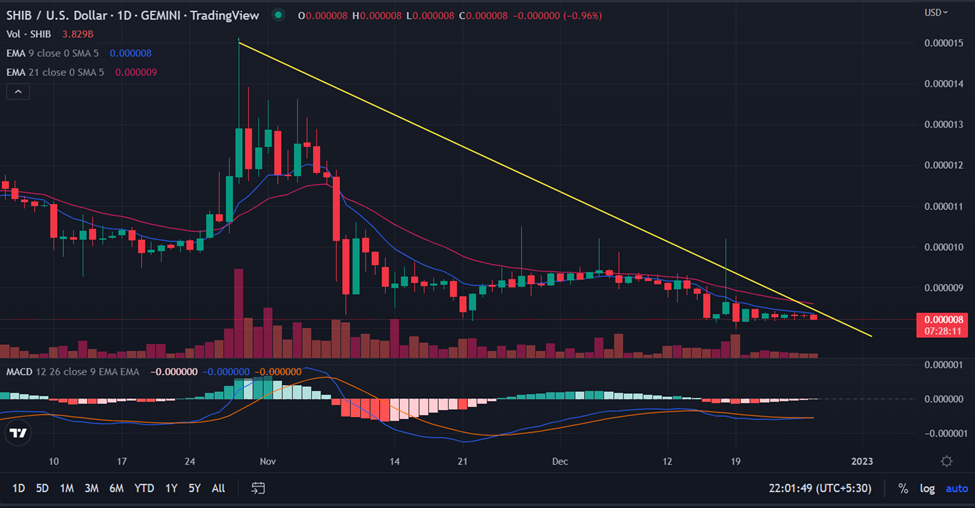
From the technical perspective, on the daily time frame, the price remains pressured below the descending trend line from the high of $0.000015 since October 29. The bulls made attempt to breach the upside barricade but could not move beyond $0.000010.
Further, the selling pressure drags the price lower breaking below the 9-day and 50-day moving average crossover. The price is crawling below the critical crossover signaling the selling momentum.
But, the bulls are applying force to sustain the low of $0.000008 as the formation of small candlesticks in the previous few sessions suggests.
In light of the recent price action, the sellers seem to have the upper hand. A break below the session’s low would set the path for further lower levels in the short term. If that happens, the first downside target could be seen around the low 19, of December at $0.0000794.
More sellers could join the downfall to capitalize on the opportunity. The price could test $0.0000730.
On the other side of the coin, the break above the bearish trendline along with a candlestick above $0.0000835 could alter the current price trend. Bulls would keep their eye on $0.00000090.
The Moving Average Convergence Divergence (MACD) trades below the central line with a diminishing bearish histogram. Any downtick would mean the sellers are once again active in the token.