SOL Tests a Key Support at $135: Can Solana Force a Rebound This Week?
- Solana (SOL) holds the $135 support after a 21 percent decline from last week’s highs.
- Oversold indicators hint at a possible short bounce if buyers defend key zones.
- Failure at support may expose the $120 to $110 range and the $100 level next.
Solana began the previous week on a bearish footing, entering a heavy selloff that erased nearly all gains accumulated earlier in the quarter. After opening near $164, SOL briefly touched $171 before plunging 21% to a weekly low of $134, where the price finally collided with the strong $135–$126 support region.
This zone has now become the main battleground, determining whether SOL can mount a rebound or sink into deeper corrective territory. With the market still weighed down by aggressive selling and shaken long positions, Solana’s ability to defend this support will define its trajectory over the next seven days.
A Week Dominated by Sellers as Confidence Drops
Solana spent the entire week under pressure, and the numbers across all timeframes tell the story clearly. The token slipped 1% over the past day, lost 16% through the week, and is now down 24% for the month. It’s one of the sharpest pullbacks the asset has seen in recent months.
This sharp decline aligns with a visible shift in behavior across the volume chart. Throughout the past week, Solana remained in a distribution phase, where red sell-volume bars expanded during each drop, while green buy-volume bars shrank, signaling weak buyer conviction.
Data from CoinGlass adds another layer to the picture. More than $19 million in long positions were wiped out in the past 24 hours, compared with only $2.55 million in shorts, a clear sign of a long squeeze.
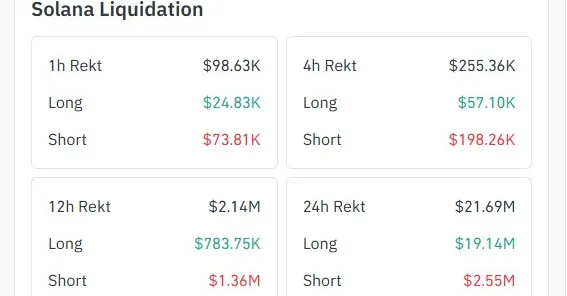
This type of liquidation wave applies downward pressure as exchanges force-close long positions, accelerating sell-offs rather than allowing natural stabilization. Conditions in the derivatives market have weakened as well. Open interest has collapsed from its $17.10 billion peak in September to about $7.10 billion, reflecting a significant retreat from speculative activity.
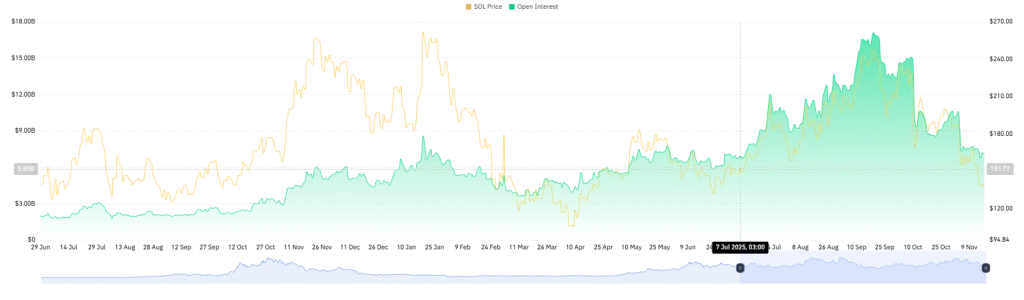
This suggests that many participants have either taken profit, cut exposure, or stepped aside entirely. Historically, such steep drops in open interest often lead to price stagnation unless a strong catalyst appears.
Technical Signals Flash Oversold: Mapping the Next Price Targets
Despite the prevailing bearish trend, several technical indicators show that SOL is entering oversold territory, a condition that often precedes short-term bounces. One such index is the RSI reading at 33, placing the token near the oversold territory.
Murrey Math signals add to this picture, with the token sitting at the 1/8 and 2/8 oversold bands. These bands have repeatedly acted as launch points for short-lived recoveries, especially when market pressure aligns with decisive volume spikes and a clearly defined support floor.
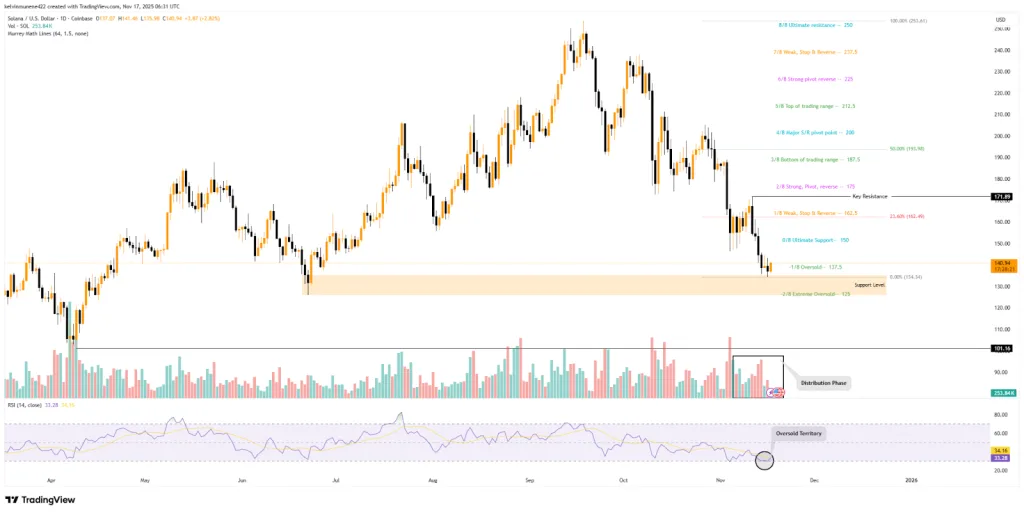
That dynamic gives even more weight to the $135–$126 support corridor, one of the most technically significant areas on the current chart. This zone previously fueled strong upward movements and now represents the last notable cluster of buyer interest before deeper downside levels come into focus.
Related: Bitcoin Falls Toward Key Levels as Liquidations Strike Hard
Key Levels To Watch
Should the support remain firm and spark a rebound, SOL could first advance toward $150, a level that would signal the early stages of renewed bullish momentum. A sustained push above that zone may clear the path toward $162, which aligns with the 23.60% Fibonacci retracement, and potentially bring the token back into contact with last week’s $171 resistance zone before the week concludes.
However, if sellers overwhelm this support band, the market could slip into deeper territory. A breakdown below $135–$126 exposes the $120–$110 range, with the psychologically significant $100 level emerging as the next major downside target if momentum continues to erode.