The cryptocurrency sphere, known for its high volatility, is again in the spotlight with Solana (SOL), a key player in the digital currency market. Echoing the sentiments of prominent crypto analysts like Crypto Tony and Rekt Capital, there’s a heightened focus on Solana’s performance, especially regarding its ability to sustain above the $76.00 mark.
Crypto Tony maintains a bullish stance, holding a long position above this price level. However, recent market trends indicate potential challenges ahead.
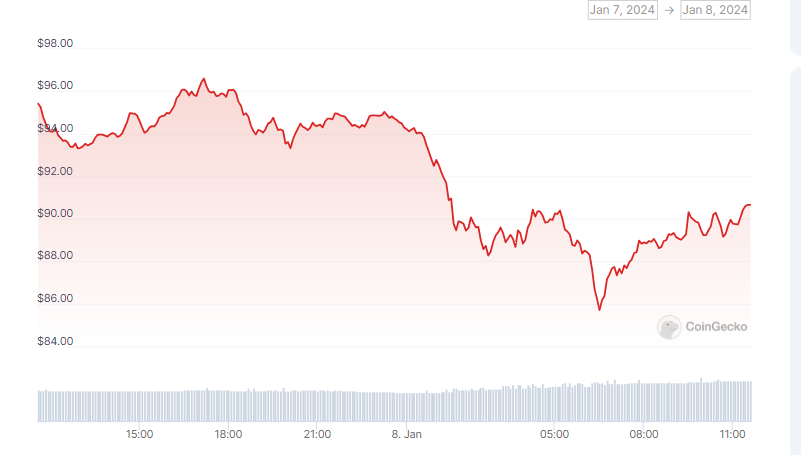
Currently, Solana is trading at $89.89, facing significant headwinds. It has experienced a 5.35% decline in the last 24 hours, accompanied by a more substantial 12.10% drop over the last week. These price movements have notably decreased Solana’s market capitalization to around $38.92 billion, considering its circulating supply of 430 million SOL, against a hefty trading volume of $2.9 billion in the same timeframe.
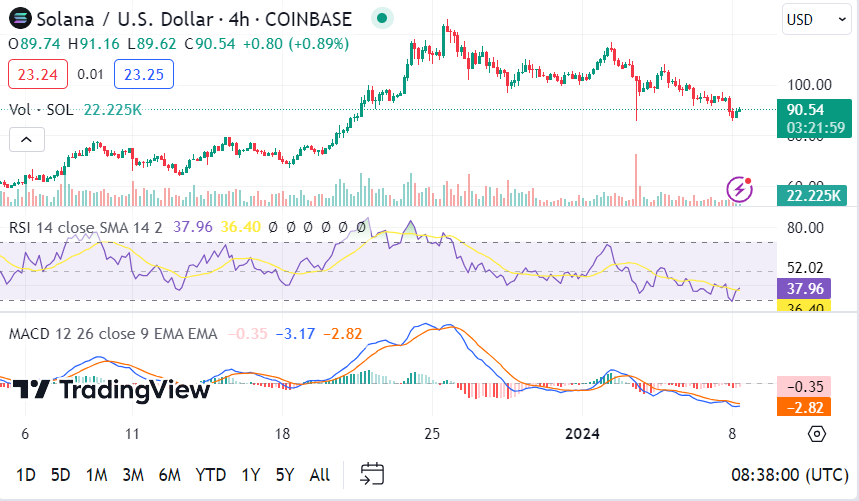
The Relative Strength Index (RSI) for Solana is at 37.96, signaling a slightly oversold condition. Typically, such an RSI level suggests the possibility of an upcoming price rebound or stabilization phase. Additionally, the 4-hour Moving Average Convergence Divergence (MACD) analysis points to a strong ongoing selling pressure, hinting at a persistent bearish trend in the near term.
Adding to the analysis, Rekt Capital highlighted a weak reaction from Solana’s Range Low, a critical support level. This response has quickly reversed, raising alarms about SOL’s ability to maintain this essential support. A weekly close below the Range Low might initiate a more significant breakdown, potentially leading to lower price levels indicated by the green area in the price charts.
The Know Sure Thing (KST) oscillator corroborates the strong bearish momentum that Solana is currently experiencing. This aligns with the overall market sentiment, which is gearing up for further declines in the short term. These indicators are crucial for investors and traders in deciphering SOL’s forthcoming trajectory.
Solana currently stands at a crossroads, displaying a mix of bearish trends with a potential for rebound. Investors like Crypto Tony, advocating for long positions above $76.00, should remain vigilant. The next few days are pivotal in determining whether Solana will undergo stabilization, consolidation, or continue its downward trend, influenced by various market dynamics and technical indicators.