
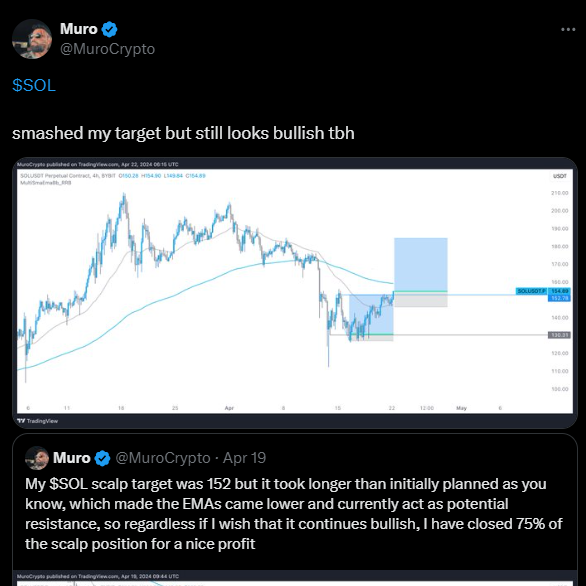
Solana (SOL), a prominent cryptocurrency, has exhibited a dynamic price movement recently. As highlighted by Muro, an analyst, the price chart shows signs of potential bullish activity amid market fluctuations. Analyzing the chart reveals intriguing patterns and key levels that could influence future market sentiment.
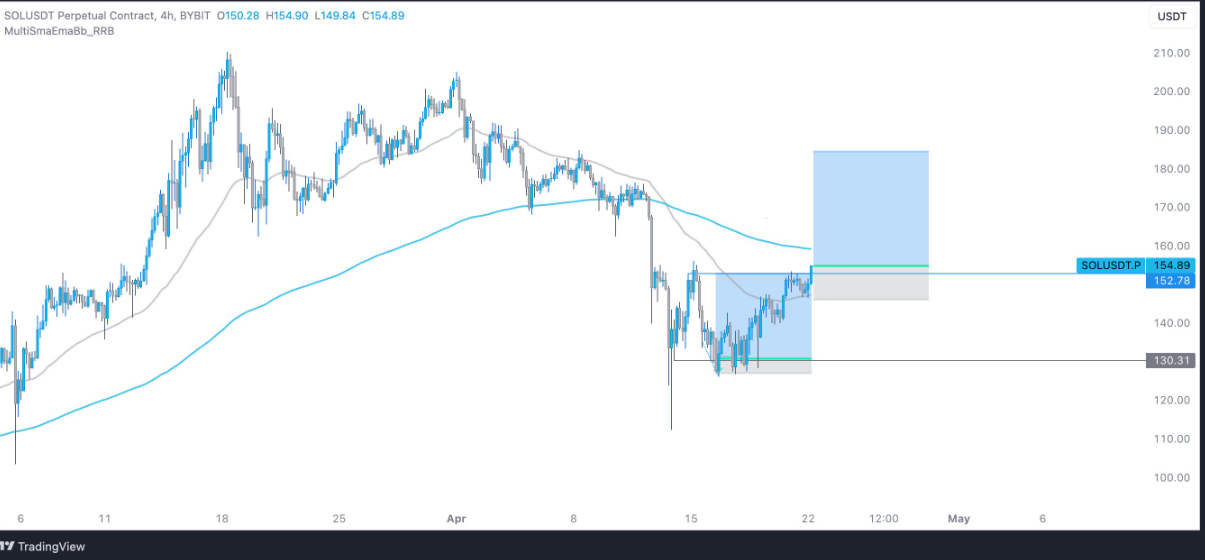
Notably, a crucial support level emerged around $130.31, indicating strong buying interest whenever the price approached this mark. Conversely, a resistance level at approximately $154.89 has presented a barrier, with the price struggling to breach this point convincingly.
Currently, SOL is testing this resistance level, which, if surpassed with significant volume, could signal a potential reversal of the recent downtrend and pave the way for a new uptrend phase.
A 200-period moving average on the chart, acting as resistance during the downtrend, adds another layer of analysis. The recent breakthrough above this moving average line suggests a bullish sentiment, potentially supporting upward price movement.
Moreover, a consolidation zone between $140 and $154 indicates a period of price range-bound activity before a potential breakout toward the resistance level.
In technical terms, a successful breach of resistance indicates market strength and could lead to sustained upward momentum. Conversely, failure to surpass resistance, followed by a decline below, may signal weakness and prompt a retest of lower support levels.
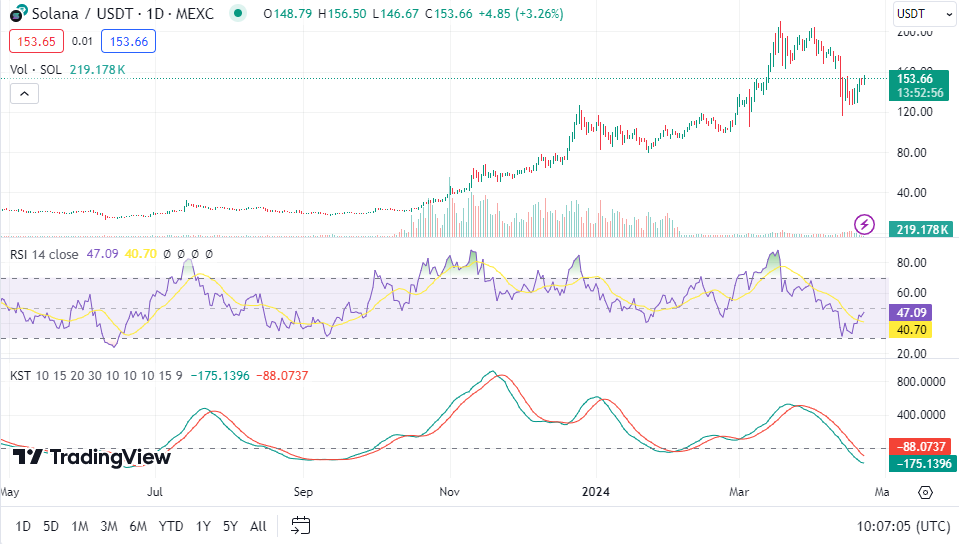
Analyzing SOL’s current metrics, the 1-day RSI reading of 47.19 suggests a neutral market sentiment, neither overbought nor oversold, potentially hinting at an imminent price reversal. However, the 1-day MACD trading below the signal line and the 1-day KST indicate a bearish trend in the short term, adding complexity to the current market outlook.
The price of Solana at press time stands at $153.41, with notable trading volume over the last 24 hours. The recent upward movement in price, alongside key technical indicators, underscores the importance of closely monitoring the market for potential shifts in sentiment and trend.