SPX Soars 16% as Fed Slashes Rates, What Comes Next?
- SPX rallied 16% after the Fed cuts, with bulls holding a fragile edge in price action.
- Breakout and retest patterns show room for upside if resistance levels are cleared.
- Liquidation data and funding rates point to stronger trader confidence in SPX gains.
The SPX token soared 16% in value after the Federal Reserve announced its latest rate cut, sending a jolt through markets. The decision lowered the federal funds target range by a quarter point to 4–4.25 percent, as policymakers pointed to cooling job growth, a mild rise in unemployment, and inflation that, while still above target, appears more manageable.
The decision was split, with Governor Stephen Miran pushing for a deeper 50-point cut. However, traders reacted quickly. SPX jumped from $1.2748 to $1.4824 between 6:00 pm and 11:00 pm UTC, fueled by heavy buying. Charts lit up with tall green volume candlesticks signaling bullish conviction, while brief red dips showed sellers struggling to keep pace.
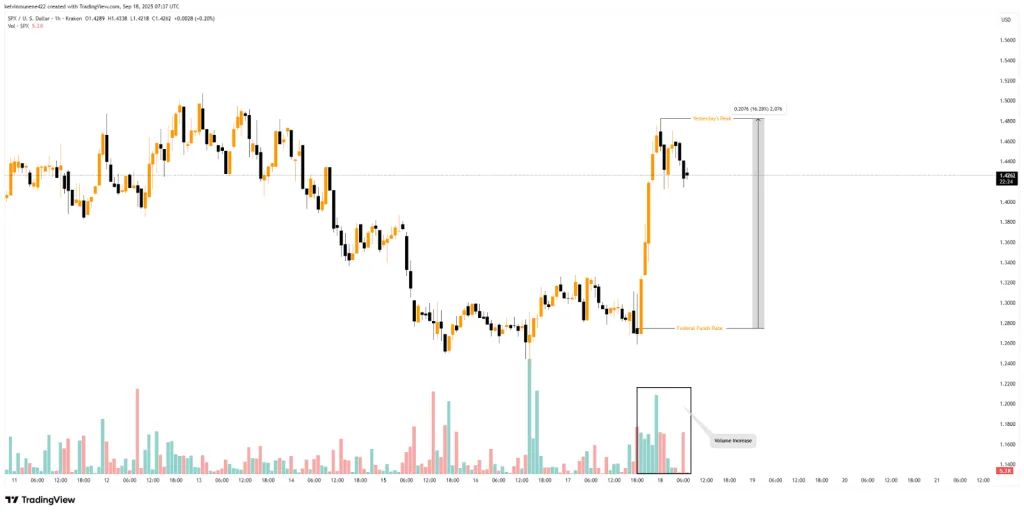
Source: TradingView
On-chain signals supported the rally. CoinGlass data revealed $93.66K worth of short positions being liquidated over the last 24 hours, nearly double the $54.37K worth of long positions that were wiped out. While moderate, this imbalance reflects the tilt in directional bias towards the upside amongst traders, thus giving bulls leverage into the next upward jump.
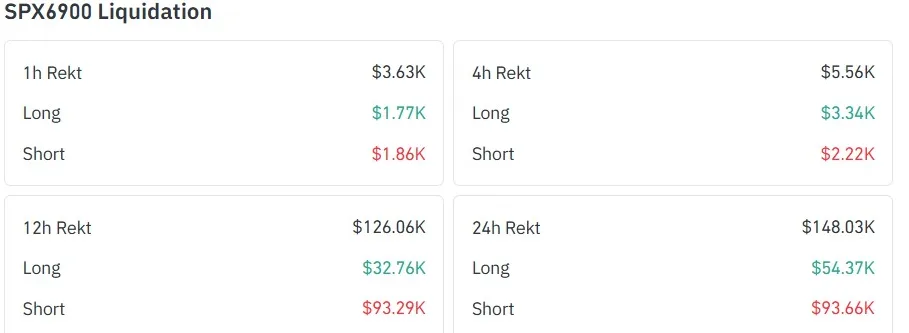
Source: CoinGlass
SPX Price Action: Breakout and Retest Pattern
On the daily chart, the SPX token recently broke above a resistance trendline that had capped its upward momentum since late July. The breakout initially stalled near the 38.60% Fibonacci retracement level at $1.51, with prices briefly touching $1.55 before sellers forced a pullback.
That retracement sent SPX down to $1.23, a region that coincided with the old trendline. Instead of collapsing, the token rebounded, casting a classic breakout-and-retest formation that many traders see as bullish confirmation and an opportunity to go long.
True to its purpose, the structure staged a swift recovery, with SPX rallying more than 15% to trade around $1.41, showing resilience but still running into overhead pressure at the 38.20% Fib zone. If bulls can clear that level, the next upside target sits at the 50% retracement near $1.65.
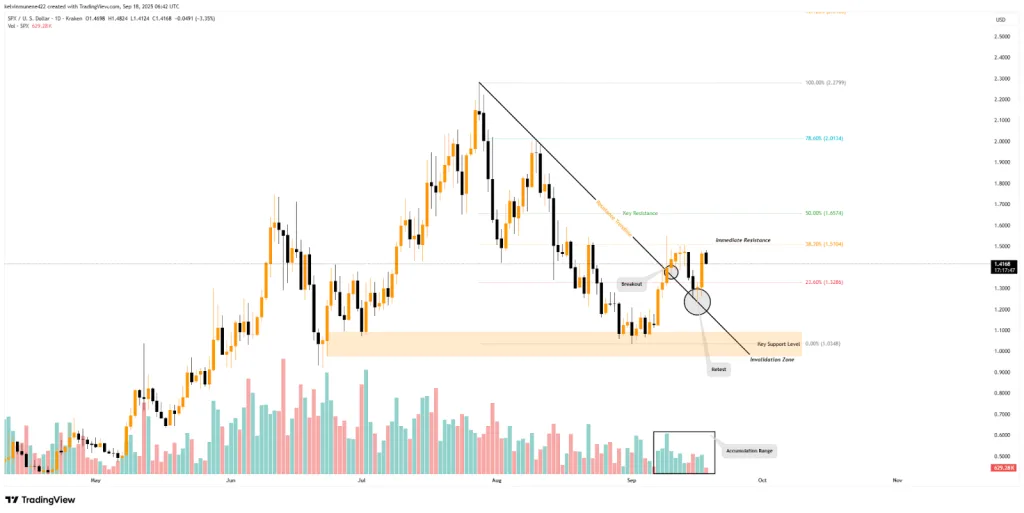
Source: TradingView
Beyond it, the path opens toward $2.01 at the 78.20% Fib mark, last tested in mid-August, and possibly even this year’s high of $2.27, achieved in late July. That would represent a gain of nearly 60% from current levels.
Volume shifts support the bullish case. Tradingview data indicates a re-accumulation phase, which is a sign of buyers accumulating for the next upside. Such activity often precedes sustained upward momentum.
Still, risks remain. A break below the support could see SPX retest its $1.09-$0.97 levels. A definite breakdown beneath that zone would invalidate the bullish pattern and turn sentiment to a deeper bearish perspective.
Technical Gauges Suggest Balanced Yet Bullish Outlook
From a technical perspective, the RSI index is hinting at a neutral stance as its RSI line hovers slightly above the neutral 50 level at 56.06. From a broader outlook, the RSI originates from oversold levels and is edging higher.
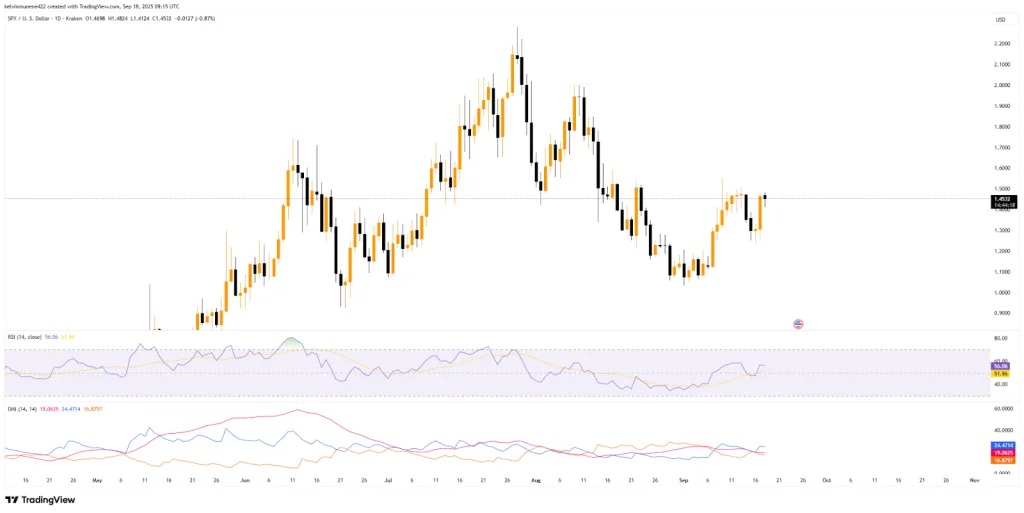
Source: TradingView
This means the bulls have the upper hand, albeit weakly. At the same time, it hints that there is space for the token to expand upwards before reaching overbought levels in the near term. The Directional Movement Index hints at a similar outlook.
At press time, the +DI is 24.4714 above the -DI, which is 16.8797, suggesting that buying pressure is higher than selling pressure. However, the ADX, at 19.0625, suggests relatively weak momentum at the moment.
Source: CoinGlass
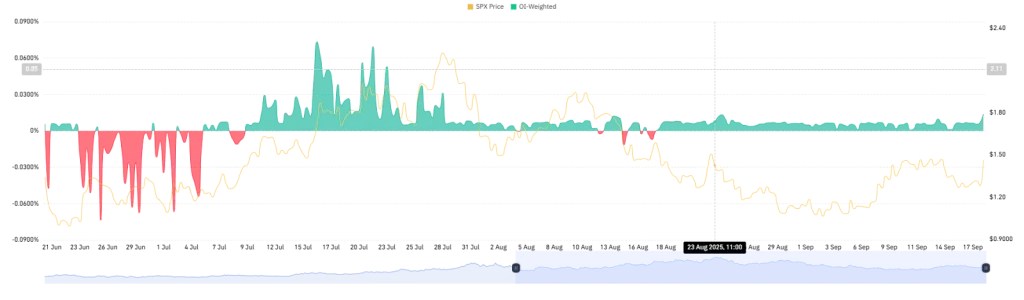
According to CoinGlass data, the OI-weighted funding rate is hovering in the positive zone around the +0.0139% level. This implies that long position holders are paying a premium to short sellers to maintain their position, which is a sign of the traders’ credibility in the token’s price increase in the near future.
Conclusion
The SPX token finds itself at a crucial junction, wedged between resistance challenges and supportive technical signals. The recent breakouts, liquidation data, and solid funding rates hint that traders are growing confident even if momentum stays subdued.
With re-accumulation patterns signaling sustained demand, the outlook tends to be bullish. However, holding onto key support zones will continue to be necessary if gains are to extend and keep the upward momentum alive in the sessions to come.