
Stacks (STX) is currently navigating a crucial juncture in its price action, reminiscent of its previous cycle highs. As per Daan Crypto Trades, an analyst, similar to the patterns observed in Bitcoin, STX has been grappling with resistance levels, notably around the $3.40 mark. However, despite the persistent struggle, there are indications that a breakthrough may be on the horizon.
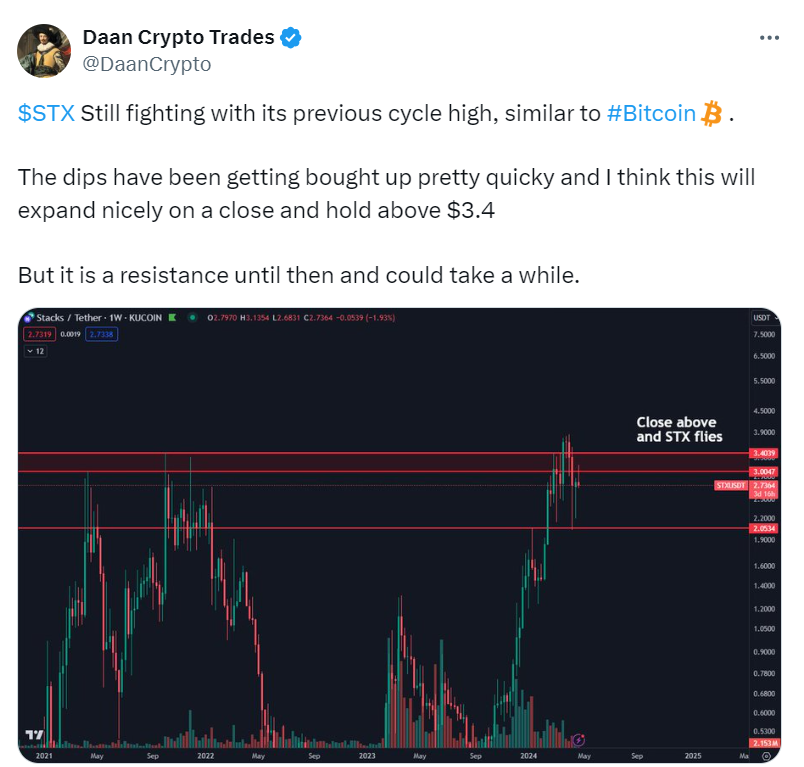
In recent weeks, dips in the price of STX have been swiftly met with buying activity, suggesting underlying strength in the asset. This resilience hints at the potential for an expansion in price, particularly if STX can successfully close and hold above the $3.40 resistance level. Yet, breaking through this barrier may not occur overnight, as overcoming resistance often requires sustained effort and bullish momentum.
As of the latest data, STX is trading at approximately $2.73, sandwiched between the resistance and support levels. The price trajectory has exhibited signs of an uptrend, with successive candlesticks reflecting higher highs and higher lows. However, the most recent candlestick is tinged red, signaling a possible pullback or reversal in the short term.
Examining trading volume provides further insights into market dynamics. Throughout the downtrend, volume remained subdued, indicating tepid interest from buyers. Conversely, as the price began to recover, trading volume surged, suggesting heightened participation and conviction among investors.
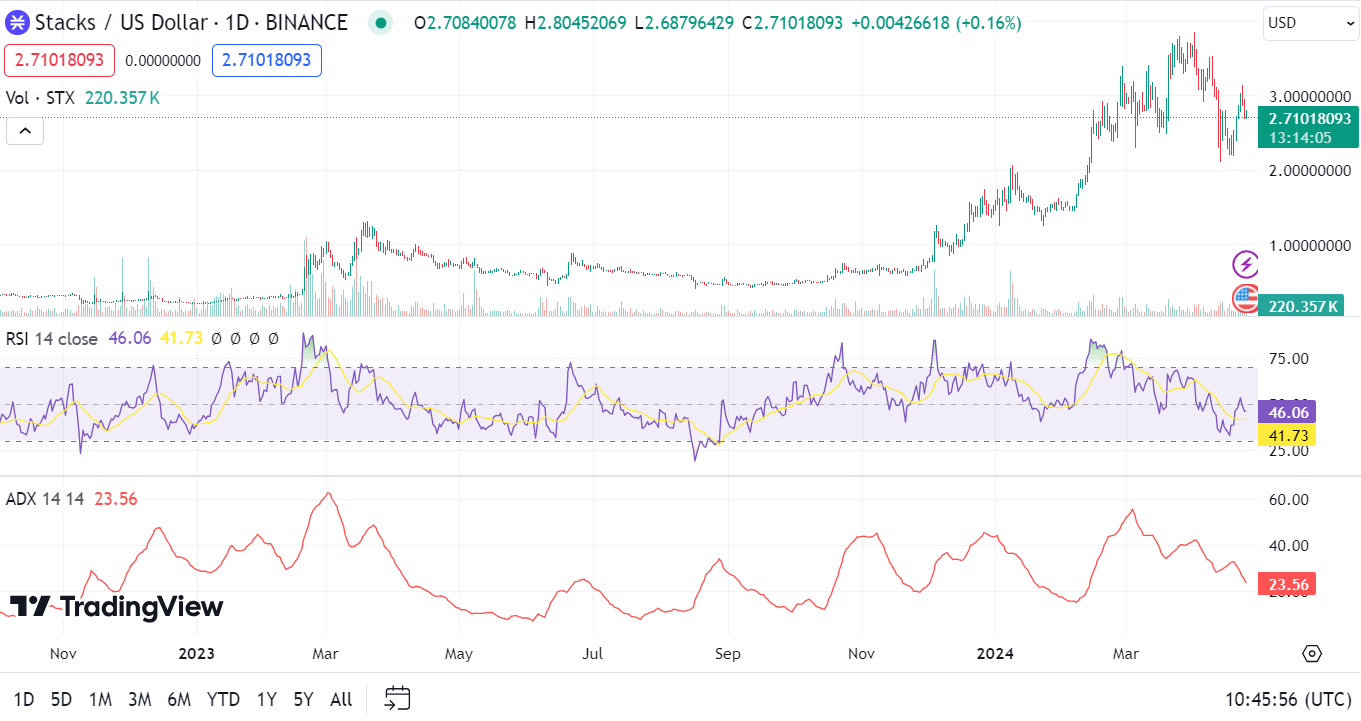
Technical indicators offer additional perspectives on STX’s current status. The 1-Day Relative Strength Index (RSI) sits at 46.29, indicating a potential proximity to oversold conditions, though not yet reaching undervalued territory. This could present opportunities for traders to consider initiating positions.
Moreover, the 1-Day Moving Average Convergence Divergence (MACD) is trading above the signal line, hinting at bullish momentum. Meanwhile, the 1-Day Average Directional Index (ADX) registers at 23.56, signaling the presence of some strength in the prevailing trend, albeit not yet reaching robust levels. Monitoring ADX for potential upticks could serve as confirmation of a more pronounced trend.