TRUMP Token Faces Fragile Balance With $8 Support at Risk

- TRUMP trades near $8.39 as liquidation clusters tighten around key support and resistance zones.
- RSI at 44.26 shows a bearish trend, but the upward move hints at easing selling pressure.
- Max pain levels show short risk at $8.60 and long risk at $8.21, fueling market uncertainty.
The OFFICIAL TRUMP token (TRUMP) remains entrenched in a pronounced bearish trend, having declined approximately 88% from its all-time high of $75.35 set on January 19. Current technical analysis reveals the asset is trading within a clearly defined descending channel, a pattern typically indicative of bearish continuation.
As of the latest analysis, TRUMP is testing a crucial support zone between $8.30 and $7.20. This level represents the lower boundary of the descending channel and has thus far prevented a more severe collapse.
However, each successive test of a support level within a bearish structure weakens its integrity. The pattern’s upper trendline has consistently acted as formidable dynamic resistance, repelling all attempted bullish rallies and reinforcing the prevailing selling pressure.
The Impending Apex: A Catalyst for Volatility
The token is now approaching the technical apex of this multi-month descending triangle. This convergence of trendlines often precedes a period of significant volatility and a decisive breakout.
Given the established bearish momentum and the structure’s characteristics as a continuation pattern, the probability of a downward resolution is elevated. A confirmed breakdown below the $7.20 support, followed by a retest of that level as new resistance, would signal a continuation of the bear trend.
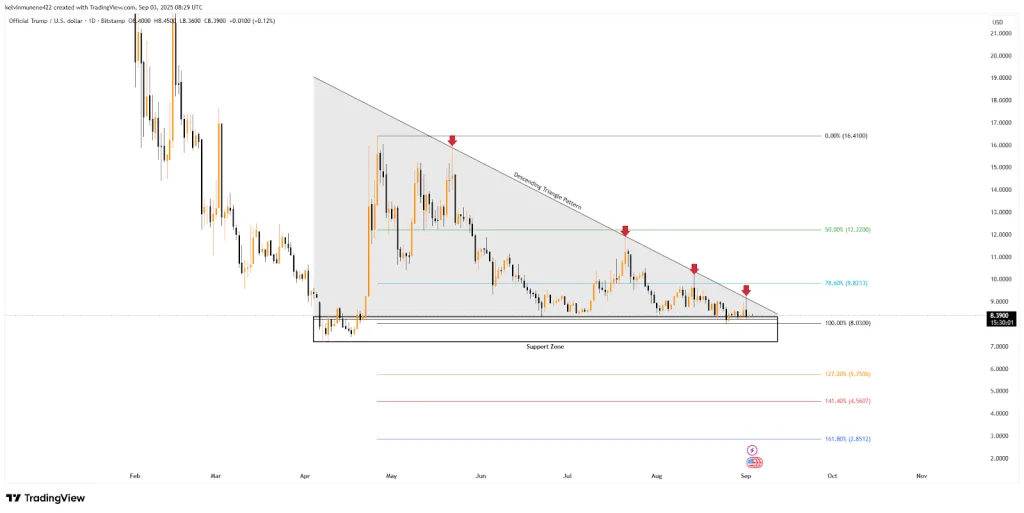
Such a scenario would open a path toward lower Fibonacci extension targets. The primary downside objectives are the $5.75 and $4.50 levels. Under extreme bearish circumstances, a drop to the $2.85 area cannot be ruled out.
On the flip side, although less likely, a decisive breakout above the channel’s resistance trendline has the potential to negate the immediate bearish outlook. High volume and a strong catalyst would be required. The first key resistance is at the 78.60% Fibonacci retracement level, at $9.82, with subsequent targets at the 50% Fib level, around $12.22, and the April high, near $16.00.
Short-Term Bullish Tilt Meets Long-Term Uncertainty
From a technical standpoint, the Relative Strength Index (RSI) stands at 44.26, which indicates a bearish trend. However, the RSI is trending upward, suggesting potential easing of bearish pressure.
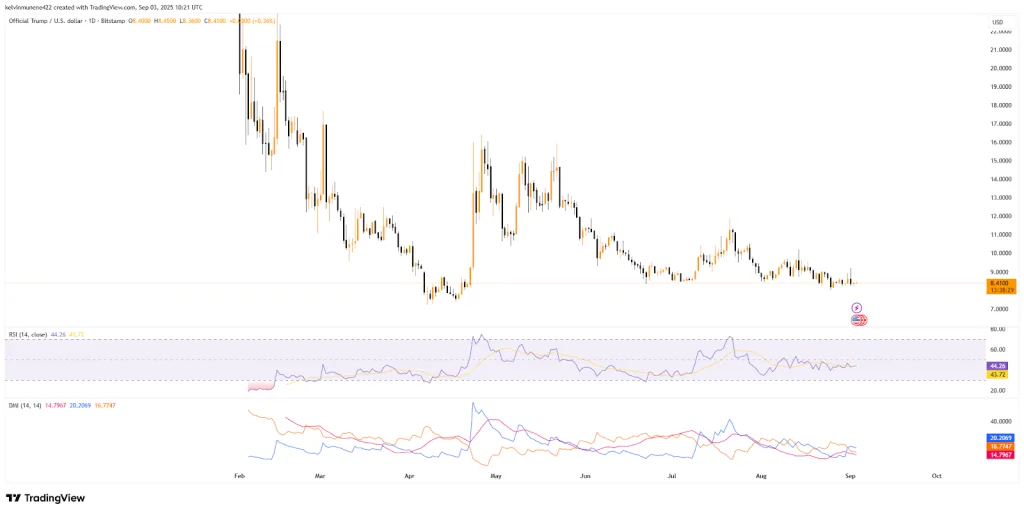
The Directional Movement Index (DMI) further supports this. The +DI sits at 20.20, slightly above the –DI at 16.77, showing bulls maintain marginal short-term control. Yet the Average Directional Index (ADX) at 14.79 signals very weak momentum. In practice, this means there is buying pressure, but not enough to confirm a strong trend reversal.
Related: Shiba Inu Traders Eye Autumn 2025 as Token Struggles Under Bearish Pressure
On-Chain Data Maps a Fragile Balance
On-chain data reinforces the narrative of fragile equilibrium. The TRUMP liquidation map illustrates strong clusters of long and short liquidation levels near the current price of $8.39.
The most prominent short liquidations are noticeable at higher price ranges, specifically around $8.50–$8.80 and above. This indicates that an upward rally could spark a short squeeze, sending bullish momentum soaring in the short term.
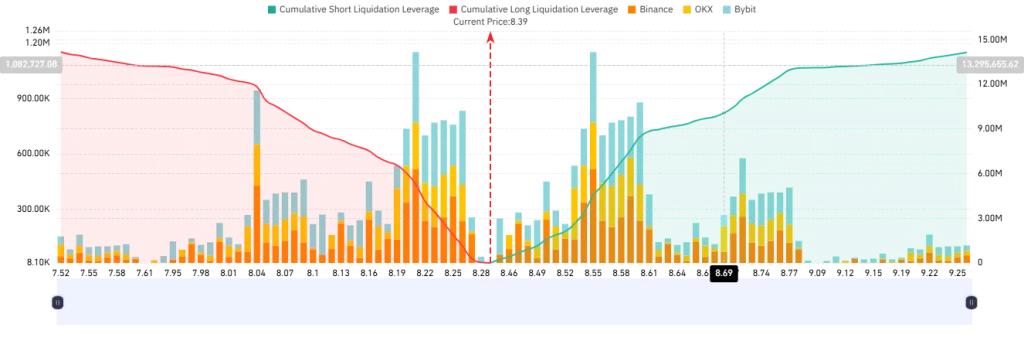
The downside seems equally concerning. There is a significant clustering of long positions between $8.26 and $8.04. A decline to this level would likely initiate widespread long liquidation, resulting in additional selling pressure to worsen the current bearish trend.
The max pain liquidation levels provide additional insight. In the last 24 hours, the short max pain has been at $8.60, nearly +2.24 from the current price, with a liquidation volume of 722.13K TRUMP.
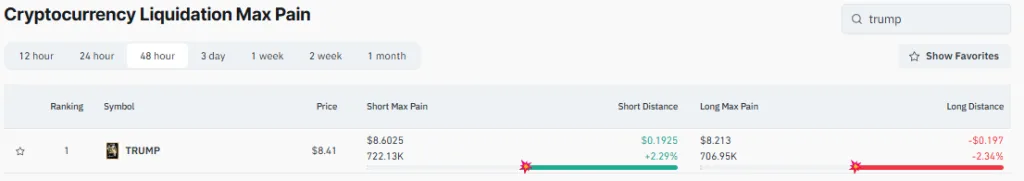
On the downside, the Long Max Pain is at $8.21, which is -2.37% below spot and corresponds to 706.95k tokens. This shows that liquidation pressure is almost even on both sides, and the market is susceptible to abrupt changes in momentum.
Conclusion
The TRUMP token remains locked in a precarious balance, with technical signals and on-chain data pointing to fragile stability. While buyers show tentative signs of re-entry, weak momentum and heavy liquidation clusters on both sides create heightened risk of sharp volatility. Whether the next move brings recovery or deeper losses, the market’s direction hinges on which side of this equilibrium gives way first.