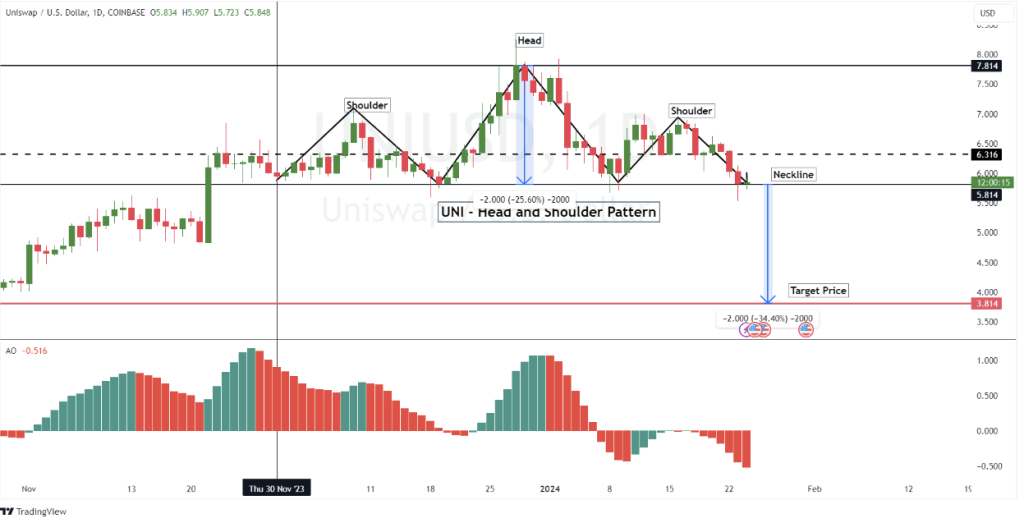
- Uniswap recently experienced a sharp 15% drop in value, forming a bearish Head and Shoulders pattern.
- Liquidations have disproportionately affected bullish traders, with over $2.2 million liquidated compared to $87,000 for bears.
- Technical indicators like MACD and RSI show mixed signals, hinting at potential fluctuations in Uniswap’s market momentum.
Uniswap has recently been at the forefront of market discussions due to a notable decrease in its price. Initially showing promise early in the month, the decentralized finance (DeFi) token has since faced a downward correction. This trend is especially concerning as it aligns with a recognized bearish reversal pattern in technical analysis, potentially indicating extended losses ahead.
Over the past week, Uniswap has seen its value diminish by over 15%, with current indications suggesting that this downward trajectory could continue. A significant impact of this decline has been on investors that had taken long positions in UNI. With the token failing to maintain its support level of around $6.00, these long positions have led to substantial liquidations, totaling upwards of $2.2 million. In contrast, short position holders have faced far fewer liquidations, amounting to just $87,000. This stark difference highlights the greater impact on optimistic investors during this bearish phase.

At the time of writing, Uniswap is trading at around $5.85, with a 24-hour trading volume of approximately $99 million. Despite a slight 2.58% increase in the last 24 hours, its market capitalization stands at about $3.5 billion, ranking it 23rd on CoinMarketCap. The total supply of UNI coins is capped at 1 billion, with nearly 600 million currently in circulation.
The current market conditions and the formation of a Head and Shoulders pattern signify a potential shift from bullish to bearish sentiment for Uniswap. This pattern is characterized by a central peak (the head) flanked by two lower peaks (the shoulders). For this pattern to confirm a bearish trend, the price of UNI would need to fall below the ‘neckline consistently,’ currently at $5.81.
A definitive break below this level could foreshadow a significant downturn, potentially leading to a price as low as $3.81, a 35% decline from current levels. However, the future of Uniswap’s price is not set in stone. If bullish signals emerge and the price reclaims $6.31 as a support level, it would negate the bearish pattern, possibly pushing the price above $6.50.
The Moving Average Convergence Divergence (MACD) shows a mild bullish crossover, while the Relative Strength Index (RSI) hovers just below 50, indicating a relatively balanced market. Moreover, the Awesome Oscillator (AO) does not show signs of bearish momentum. The trading day began with Uniswap moving above the $5.80 mark, crossing the Simple Moving Average (SMA) 100, which could be interpreted as a bullish pattern.
In conclusion, while the bearish reversal pattern and recent liquidation trends paint a bleak picture for Uniswap, the market’s inherent volatility, and conflicting technical indicators suggest that the token’s future price movement could still see significant fluctuations. Investors and traders in the cryptocurrency market should closely monitor these developments as Uniswap navigates through these uncertain times.


