
The digital currency landscape is buzzing with anticipation as VeChain (VET) shows signs of a significant upswing. Currently priced at $0.035084, VET has seen a notable 10.63% increase in the last 24 hours, with trading volumes reaching $92,643,737. This surge has sparked conversations around its potential trajectory.
As highlighted by Ali Martinez, an analyst, Vechain speculates a climb to $0.054 in the coming week, followed by a temporary dip until June. He forecasts a bull run that could elevate VET to $0.70 by November. This prediction hinges on mastering VET’s wave count, which could unlock optimal selling strategies to maximize returns.
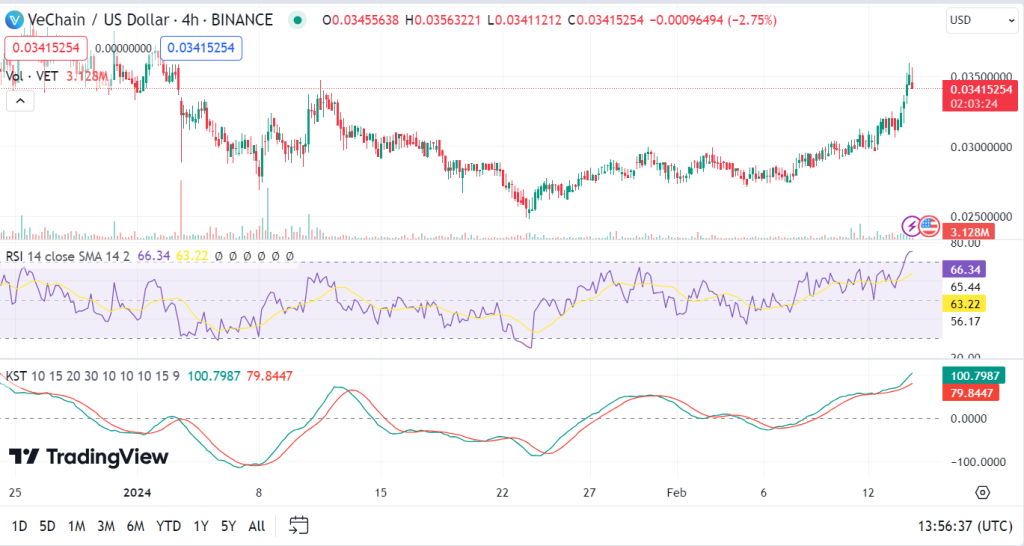
VeChain’s current momentum is underpinned by various technical indicators, with the 4-hour Relative Strength Index (RSI) standing at 70.65, indicating an overbought condition. This typically suggests a forthcoming correction or reversal.
However, the Moving Average Convergence Divergence (MACD) in the same timeframe presents a bullish outlook, indicating sustained upward momentum. The 4-hour Know Sure Thing (KST) also corroborates this positive trend, suggesting the potential for continued growth in the near term.
Investors and enthusiasts are closely monitoring these indicators to navigate their investment strategies. The blend of bullish momentum with signs of an overbought market creates a complex landscape. Hence, stakeholders must stay informed and agile, adapting their approach as the market evolves.
As noted by analyst Egrag Crypto, the broader implications of VeChain’s performance extend beyond individual gains. With increased market visibility, the platform’s unique supply chain management and logistics value proposition could see heightened interest and adoption. Consequently, a successful bull run could benefit investors and propel VeChain’s technological adoption across industries.
VeChain’s current market performance and technical indicators paint a picture of potential and volatility. Investors are advised to keep a keen eye on the evolving trends, leveraging the insights from RSI, MACD, and KST analyses. With a strategic approach, they could navigate the anticipated fluctuations and capitalize on the potential bull run, unlocking substantial financial gains.