


- XRP whales accumulate more tokens during a 6% price dip, showing confidence in long-term potential.
- Trading volume surged 83.11% amid XRP’s price decline, indicating heightened market activity and selling pressure.
- XRP nearing oversold conditions (RSI 34.26) may present a buying opportunity; MACD suggests short-term downward pressure.
Amid the recent downturn in Ripple (XRP) prices, significant whale activity has surfaced, indicating strategic market moves by large wallet investors. Over the past few days, XRP prices have dropped by nearly 6% since June 1.
The price of XRP stands at $0.485 at press time, marking a 2.04% decrease over the past day. The market cap is approximately $26.92 billion, positioning XRP as the seventh-largest cryptocurrency.
Over the last 24 hours, trading volume surged by 83.11%, reaching about $1.43 billion. This significant increase in trading volume, alongside a price decline, indicates heightened selling pressure in the market.
XRP Sees Massive Buy Volume as Price Approaches Critical Support ZoneHistorically, XRP experienced a peak around $0.505 but has since been under downward pressure. This drop pushed it below key short-term support levels. The recent stabilization around $0.485 suggests a potential support level.
However, this support needs to hold to avoid further declines. The immediate support level is the recent low of $0.485. If this level is breached, the next significant support is around $0.475.
Conversely, the primary resistance level to watch is $0.505. Breaking above this level could signal a bullish trend or a reversal. The secondary resistance level is around $0.520, a historically strong barrier. The volume-to-market-cap ratio of 5.32% indicates moderate trading activity relative to the market cap. A high ratio typically suggests strong interest and potential volatility, while a low ratio might indicate consolidation.
The circulating supply of XRP is about 55.51 billion tokens, which is 55.51% of the total supply. This high supply can contribute to price stability, yet significant trades or market movements can still impact the price significantly.
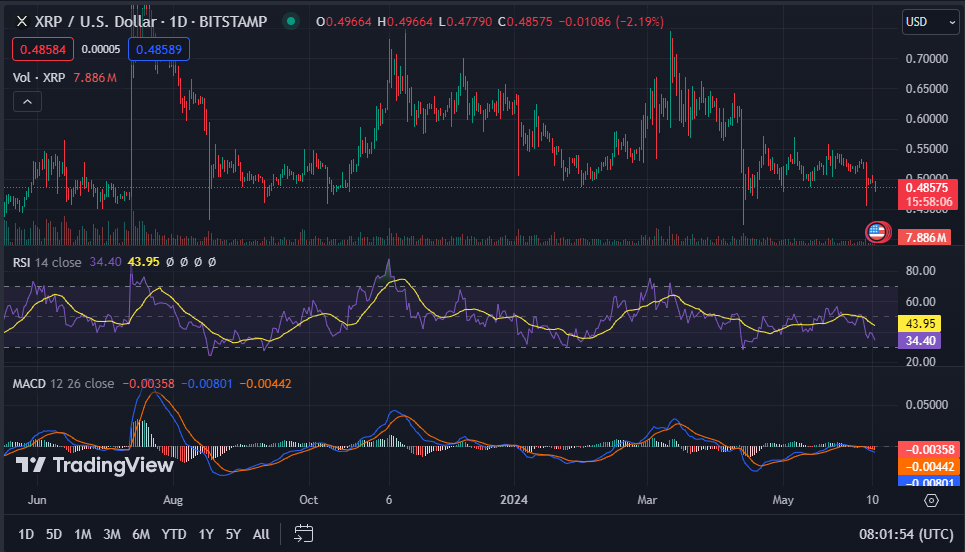
The Relative Strength Index (RSI) for XRP on a one-day chart reads 34.26. This suggests XRP may be approaching oversold conditions, potentially signaling a buying opportunity for traders. Additionally, the Moving Average Convergence Divergence (MACD) trading below the signal line suggests further downward pressure in the short term.


