What Is Inner Circle Trader (ICT) Strategy? The Complete Guide

ICT trading, also known as the Inner Circle Trader strategy, is a trading plan developed by Michael J. Huddleston. It is focused on how market makers known as “smart money” make price moves. Instead of following signals or emotions, ICT teaches traders structure, timing, and liquidity. The idea is to track down the footprints of big money players and ignore ‘retail noise’.
What does ICT Trading Mean?
ICT is a trading methodology focused on understanding how banks and hedge funds influence the markets through hidden patterns. The plan is based on the Inter-Bank Price Delivery Algorithm (IPDA). This idea implies there are no random price movements but rather are controlled by ‘big’ players.
It focuses on identifying structured market behavior, patterns shaped by institutions. Traders find these structures through elements like order blocks, fair value gaps, and liquidity zones. Each reveals how major players manage entries, exits, and liquidity, helping traders read market intent rather than random movement.
ICT incorporates the Smart Money Concept, which highlights how institutional traders often drive prices toward key levels before significant moves. Retail traders frequently miss these moves because they enter too late. ICT aims to teach traders how to recognize these institutional strategies, helping them anticipate market shifts rather than react to them.
Why the Institutional Perspective Matters?
Large institutions control most of the market’s liquidity. Their transactions create visible patterns that smaller traders could learn to track. ICT helps traders find those signs. It shows when institutions collect liquidity before making a major move.
Retail traders often lose money because they buy after the big move starts. ICT flips this mindset. It teaches traders to enter at the point where institutions are likely to enter. This reduces emotional trading and improves precision.
Understanding Market Structure
Market structure is the backbone of ICT. It defines how price trends form and change. An uptrend shows a series of higher highs and higher lows. A downtrend shows lower highs and lower lows. Recognizing this pattern helps traders identify trend direction.
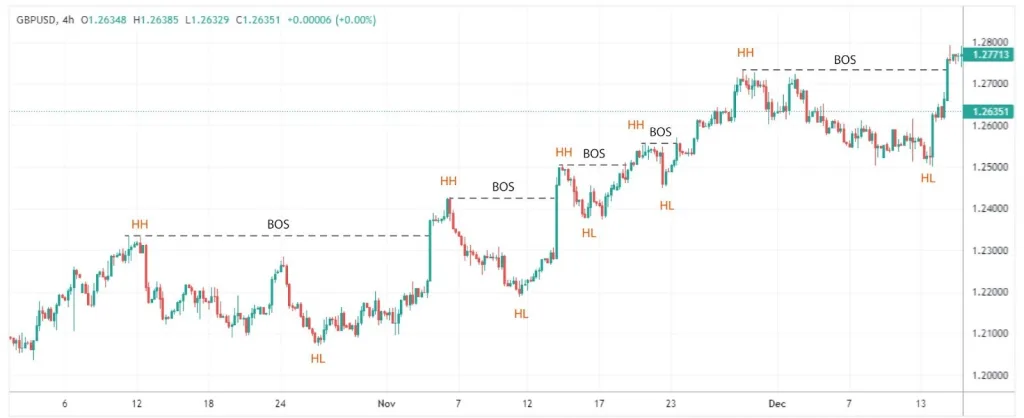
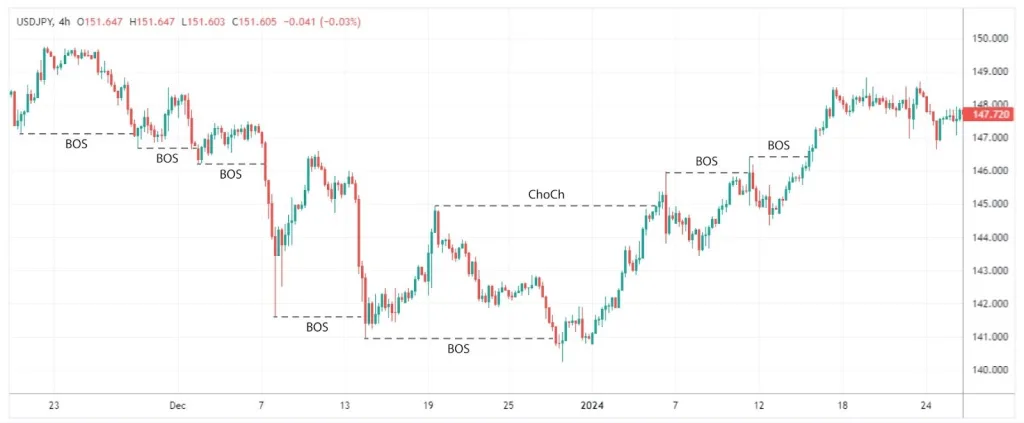
A Break of Structure (BOS) happens when price decisively breaks the most recent swing high (in an uptrend) or swing low (in a downtrend), indicating a continuation of the prevailing trend. This usually confirms trend continuation. A Change of Character (CHoCH) occurs when price breaks the most recent swing low in an uptrend or swing high in a downtrend, signaling a potential trend reversal or shift in market structure.
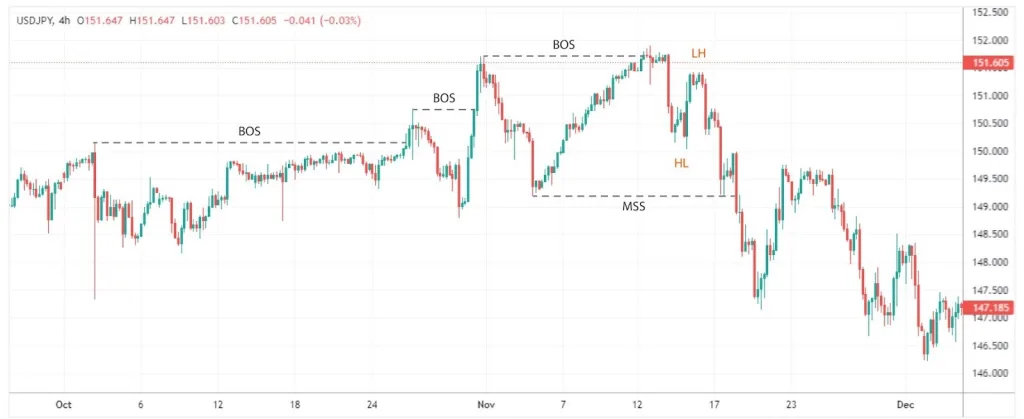
A Market Structure Shift (MSS) is more powerful than CHoCH. It occurs when the price moves significantly beyond a known level, indicating the emergence of a new trend. By recognizing these surges, traders could time their entries to move with market momentum instead of against it.
Order Blocks and Institutional Zones
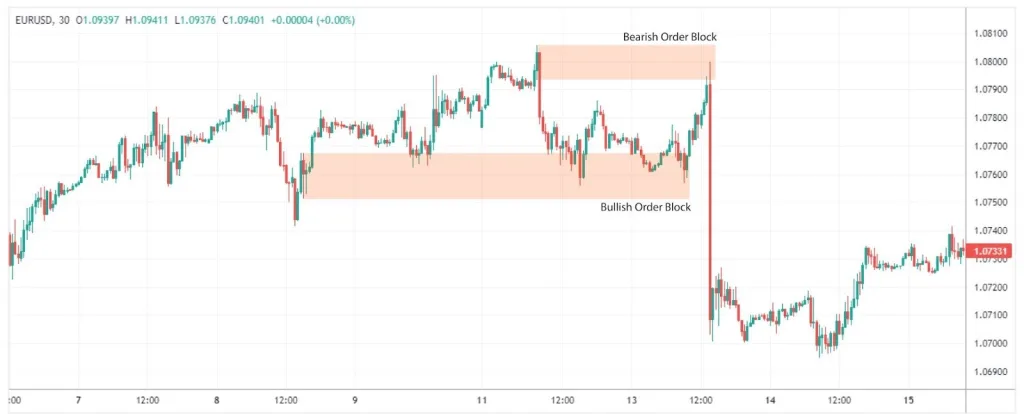
Order blocks are central to ICT. They represent the last area of buying or selling before a big move. A bullish order block forms before the price rises. A bearish order block forms before the price drops. These blocks act as institutional footprints, showing where large orders were executed.
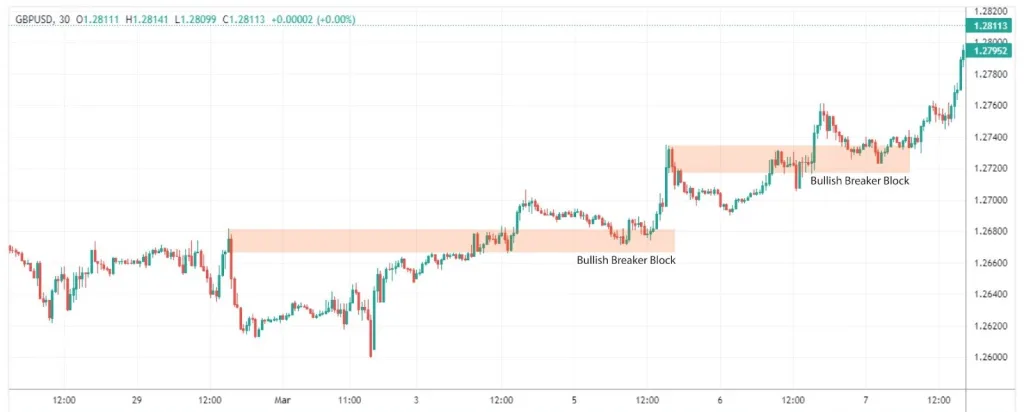
Breaker blocks form when a previous order block fails to hold and price breaks through it, signaling a structural shift and potential trend reversal. Once this happens, that same zone can act as a new area of support or resistance.
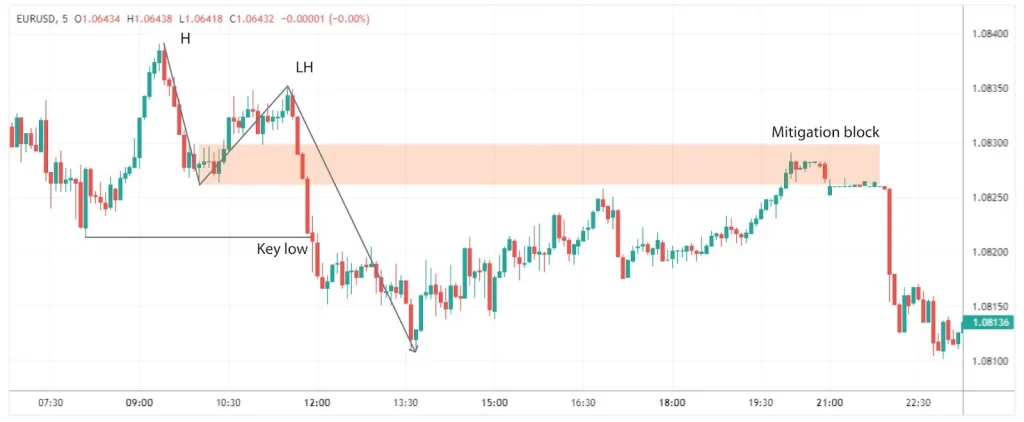
Mitigation blocks, on the other hand, appear when price revisits a previous zone to mitigate or rebalance unfilled orders before continuing in the direction of the new trend. These areas often serve as precise support or resistance levels, helping traders spot potential entry opportunities.
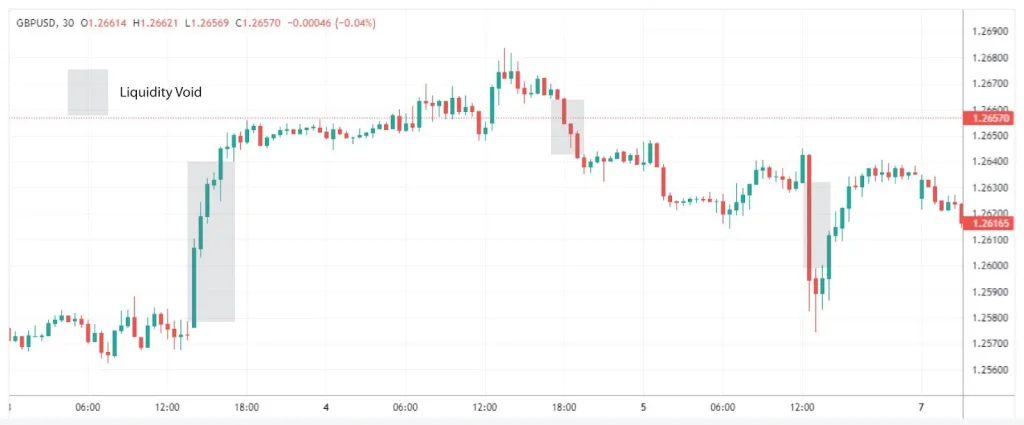
Liquidity and Stop Hunts
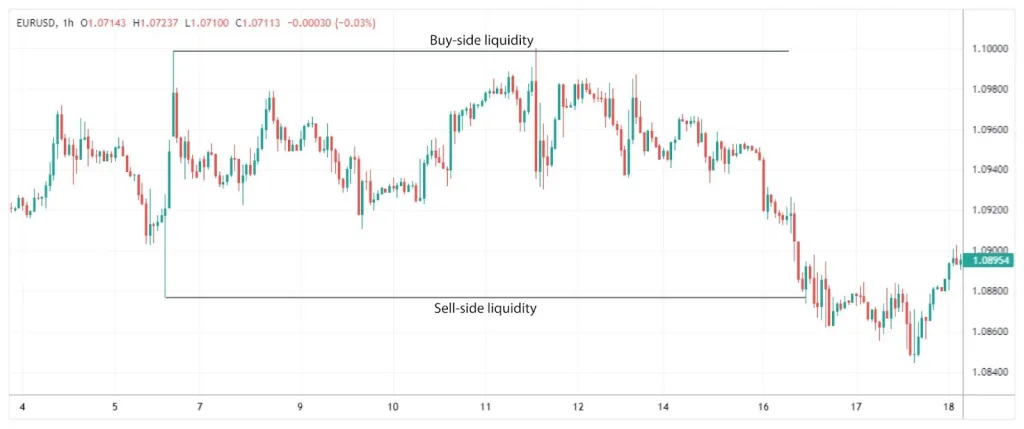
Liquidity refers to areas with a lot of orders sitting, typically near highs or lows. The buy side liquidity is above recent highs, and the sell side liquidity is below recent lows. Institutions would drive prices into these zones to hit retail stop losses.
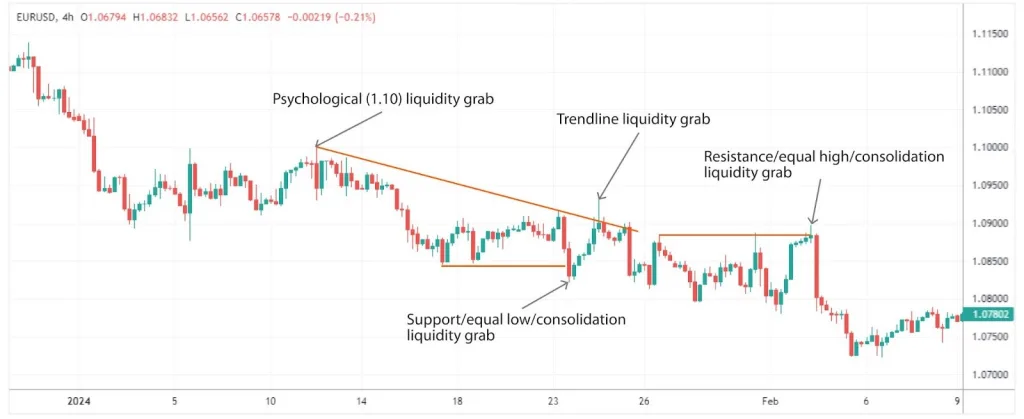
A liquidity grab happens when price spikes into such zones, triggers stops, and then reverses. This is not random movement; it’s how smart money gains position with minimal risk. Recognizing this helps traders avoid emotional entries and false breakouts.
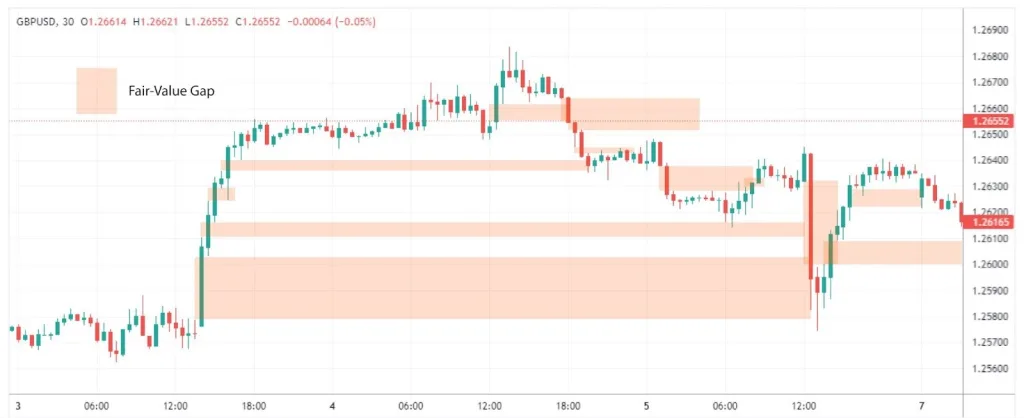
Fair Value Gaps and Displacement
A Fair Value Gap (FVG) appears when the price moves quickly and leaves a space between candle wicks with no trading in between. This shows an imbalance. Price often returns later to fill this gap before continuing its direction.
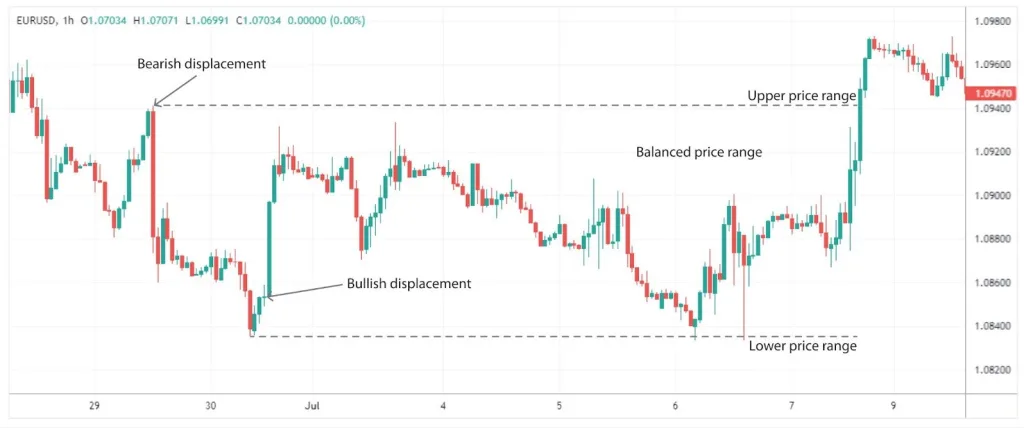
Displacement means a significant market move beyond an established trading range, which is often a sign directing the trend. For instance, displacement is when the value of a currency pair makes an unexpected move away from its support zone.
This action is mostly seen when a price significantly increases and takes out multiple levels at the same time, giving away the intention and force of market makers. Both gaps and displacements act as directional signals that guide traders toward potential retracement zones. When used together, they help refine target-driven, high-probability entry points.
Kill Zones and Time-Based Patterns
ICT identifies specific times of the day when the market falls/ rises the hardest. These are known as Kill Zones. Traders use Kill Zones to plan trades. Instead of trading all day, they focus on moments when institutions act.
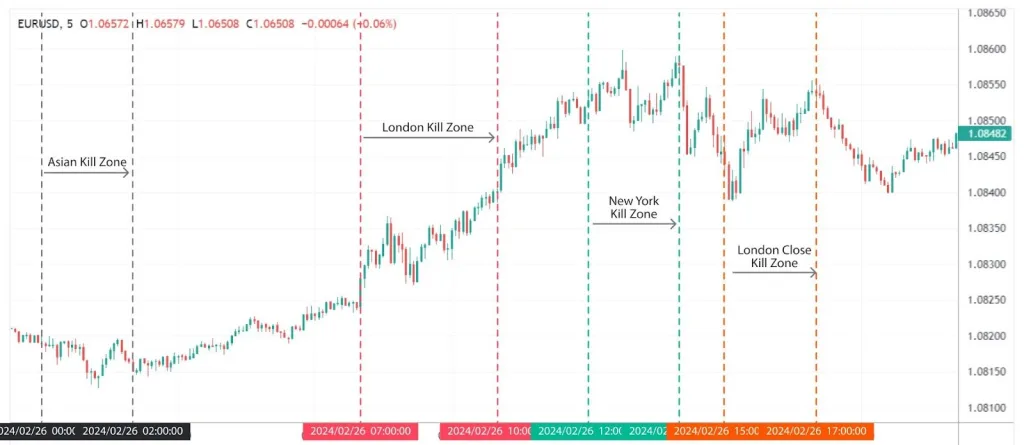
This helps filter noise and reduce unnecessary exposure. A structured routine forms, improving discipline and consistency.
Optimal Trade Entry (OTE)
An Optimal Trade Entry is a displacement and inducement. Fibonacci retracement levels, usually between 61.8 % – 78.6 %, are employed by traders. This is a point at which the price could retrace before continuing the trend.
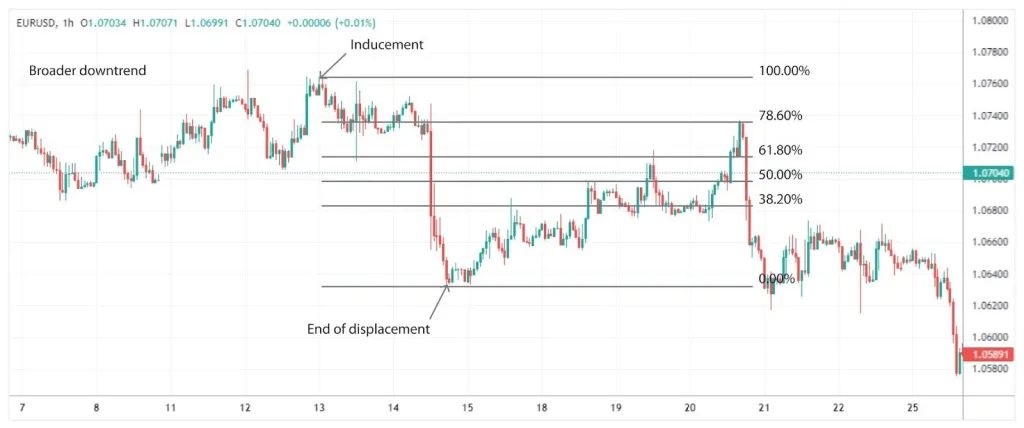
For instance, in a bearish move, they plot Fibonacci from the swing high to the new low. Price tends to react there and moves lower when it retraces the zone of 61.8 – 78.6 %. OTE provides accurate entry timing alongside institutional operations.
Balanced Price Range and Its Role in ICT Trading
A balanced range structure occurs when the market consolidates between areas of supply and demand, often identified with overlapping fair value gaps or key order blocks. Price moves within this range before eventually breaking out. While patterns like double tops or bottoms may appear, ICT traders primarily focus on order flow, liquidity zones, and structural shifts to anticipate market direction.
Steps to Apply the ICT Trading Framework
To apply ICT effectively, traders follow a clear process. First, they determine market bias from higher timeframes such as daily or weekly charts. Second, they identify structure points, order blocks, and fair value gaps.
Next, they wait for the price to revisit these zones during active sessions. They only enter after confirmation of reaction. Stop losses are placed beyond the structure point to limit risk. Finally, traders manage their positions according to momentum and new structural changes. This structured workflow reduces emotional trading. It keeps decisions logical, not impulsive.
Related: What Is an ICO? Understanding Initial Coin Offerings in 2025
Benefits of ICT Trading
ICT provides a deeper understanding of how markets function. It focuses on logic, not luck. By studying institutional behavior, traders gain better awareness of liquidity flow.
Traders learn to wait for setups rather than chase prices. The approach works across forex, indices, and commodities. It’s flexible yet disciplined, offering both long-term and short-term opportunities.
Drawbacks of ICT Trading
The learning curve is steep. There are many concepts in ICT that require time to master. Newcomers could be overburdened by all of the terms and constructs. It also demands strong discipline. One missed rule could cause confusion or losses. Some traders get “analysis paralysis,” marking too many zones and not trading them.
The Type of Trader Who Excels with ICT Strategies
ICT works for traders who like to analyze. It suits those prepared to learn how institutions behave and be attentive to price action. Those who favor order over speculation would benefit most.
In the world of cryptocurrencies, ICT is not geared towards short-term profit seekers or plug-and-play systems. It’s a discipline that requires patience and focus over the long term. The method evolves from understanding and practice.
Conclusion
CT trading is a comprehensive framework for analyzing and understanding market behavior. It demonstrates how price is a product of institutional decision-making. The emphasis is on structure, timing, and liquidity, not emotion or random signals.
Understanding the ICT would allow traders to learn what is actually behind the market movement. It’s a hard process, but the rewards are worth it. Those who could wield it approach markets not with fear and speculation, but rather precision and confidence.