Why XRP Is Down Today and What Analysts Are Watching

- Fed guidance and whale selling triggered heavy liquidations that pushed XRP lower.
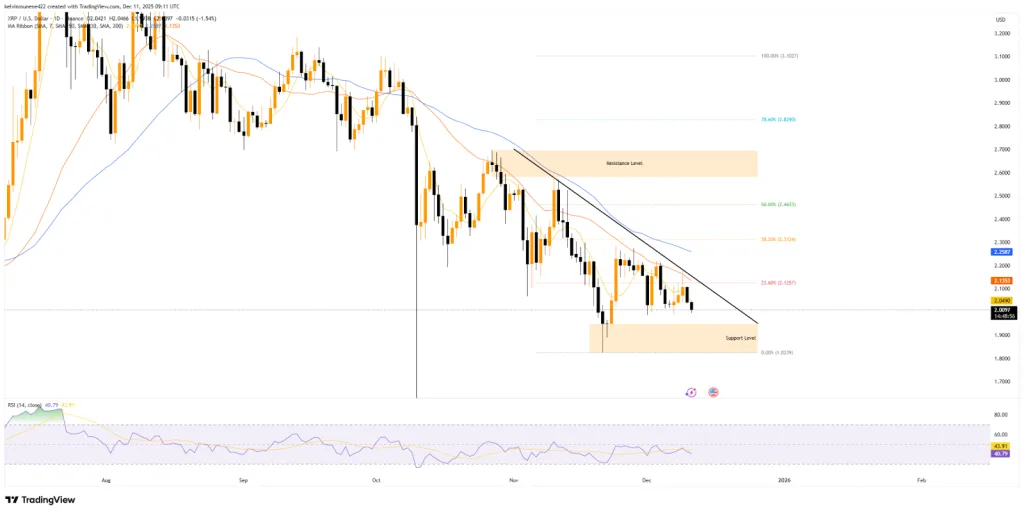
- XRP failed again at the $2.10 resistance as volume spiked and momentum weakened.
- Analysts track a triangle pattern and the key $2.00 support for the next major move.
XRP slipped nearly 3.5% today as a wave of macro pressure, liquidation spikes, and repeated resistance failures converged to pull the token back toward the $2.00 region. The downturn followed a brief lift that echoed Bitcoin’s jump to $94k before a heavy unwind swept across the market and erased those gains. Analysts note that XRP’s retreat reflects the interaction of hawkish monetary signals, whale selling, and fading momentum on the charts.
Market Repricing After Fed Decision Sparks Liquidation Wave
The Federal Reserve’s December 10 policy decision set off a swift recalibration across risk assets. Officials delivered a quarter-point cut, placing the federal funds rate in a 3.50%–3.75% range. The move marked the lowest level in three years, yet traders had already built in expectations for three cuts in 2025.
However, what rattled markets was the Fed’s guidance that suggested a likely pause until 2026, along with plans for $40 billion in Treasury bill purchases. That combination pushed investors toward more defensive positions. Blockchain data showed large Bitcoin holders selling more than $100 million worth of BTC within an hour of the announcement.
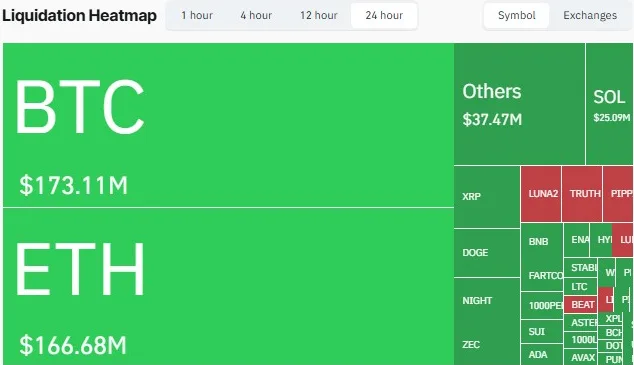
The shift widened into a broad liquidation event worth $514 million, including $173 million in Bitcoin positions and a notable unwind in leveraged XRP longs. The rapid drain of liquidity dragged XRP down 5%, sending it straight back to the $2.00 zone after a short-lived surge.
Technical Rejection at $2.10 Weakens Momentum
XRP’s technical structure played an equal role in the decline. The token failed again at the $2.09–$2.10 ceiling, a region that has stopped four breakout attempts since early December. As the price touched the upper boundary, trading volume jumped more than 205%, signaling that larger players were distributing rather than accumulating.
Momentum readings weakened as well:
- 7-day SMA: $2.04
- 30-day SMA: $2.13
- 50-day SMA: $2.25
- RSI (14): 43, holding under the midpoint
The alignment of these averages shows that sellers still control short-term flow. Analysts now point to $2.00 as the first line of support, with deeper cushions at $1.95–$1.82, matching the November low range.
ETF Activity Supports Long-Term Outlook but Fails to Offset Short-Term Pressure
The downturn unfolded just as the FalconX-21Shares XRP ETF (TOXR) secured approval and a Cboe listing. The launch, however, landed on a day dominated by macro turbulence, leaving little room for a price response.
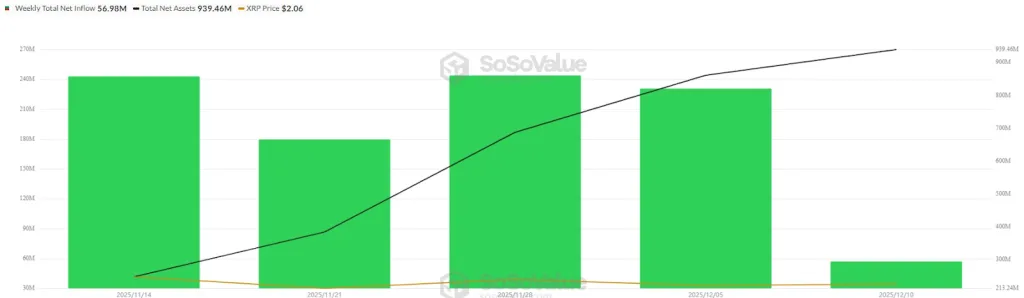
Yet, underlying demand through ETF flows remains strong:
- Weekly inflows: $56.98 million
- Total inflows since launch: $954 million
- Net assets: $939 million
- Exchange balances: down 34% from 3.95B to 2.6B XRP
A decline of that size typically signals lighter sell-side liquidity. Even so, traders remain focused on short-term volatility rather than structural developments. Analysts note that improved custody and settlement infrastructure may influence long-range stability, but the near-term direction hinges on market stress.
Analysts Track Two Key Chart Structures
Two chart watchers outlined the setups they believe will guide XRP’s next major move. One such, Javon Marks, highlighted a long-term descending trendline break that previously triggered powerful expansions in XRP’s performance relative to Bitcoin.
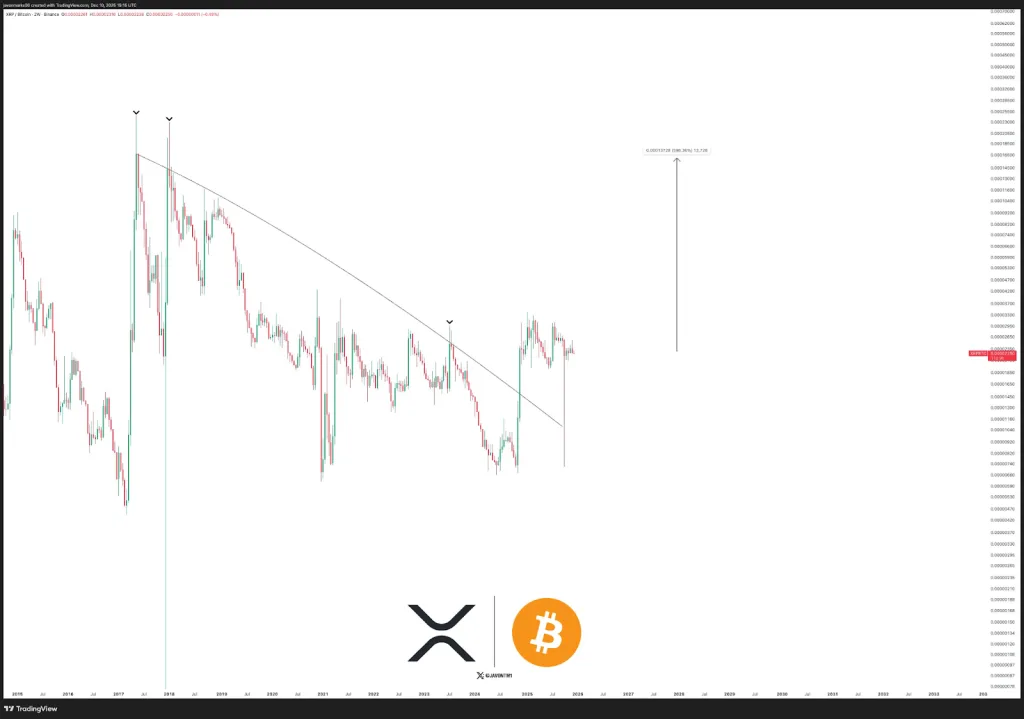
He cited a past cycle where XRP outpaced Bitcoin by more than 240%, leading to a 570% rise in XRP’s price. Marks said the current pattern resembles prior periods where XRP built relative strength after clearing major structural barriers. He further anticipates that XRP is positioned to outperform Bitcoin by more than 600%, a move that he said could lift the token beyond the $14 level.
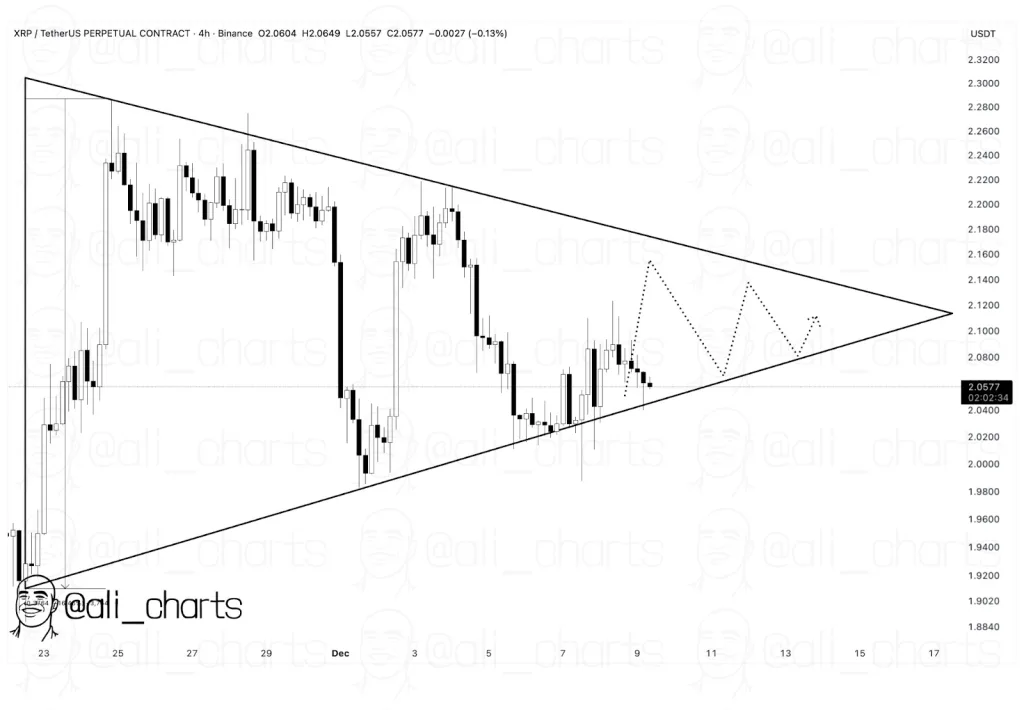
Ali, another market analyst, focused on a tightening symmetrical triangle forming on the 4-hour chart. His observation points to an upcoming 16% volatility expansion once XRP moves out of the pattern. At press time, the price continues to fluctuate between $2.00 and $2.10, with both boundaries narrowing as mid-December approaches.
Related: Zcash Bulls Test: ZEC Rally Meets Critical Resistance as Institutional Demand Surges
Outlook
XRP’s retreat stems from a clear mix of macro uncertainty, liquidation-driven pressure, and failure to break a well-defined resistance zone. Analysts say the immediate focus remains on whether the $2.00 level can hold and how the price interacts with the triangle structure that continues to compress. At the same time, ETF inflows and shrinking exchange supply show an underlying resilience that may influence the asset’s longer-term trajectory once market turbulence settles.