
- Polkadot (DOT) faces strong resistance at $8.00, repeatedly experiencing fakeouts and failing to break higher.
- The $7.50 level is pivotal for DOT, acting as a key support and resistance point influencing short-term direction.
- Technical indicators suggest cautious optimism, with the RSI neutral and the MACD showing a slight bullish crossover.
Polkadot (DOT) has been navigating tricky terrain in recent times, particularly within the USDT Perpetual Contract on a 4-hour timeframe. The chart analysis highlights critical insights into DOT’s price behavior and suggests potential future movements. At press time, the cryptocurrency is trading at $7.42 with a 24-hour trading volume of $292,187,791, marking a 0.74% decline in the last 24 hours.
DOT has faced several resistance tests around the $8.00 mark, repeatedly encountering selling pressure that halts its upward momentum. These “Zones of Fakeout” indicate robust resistance, where buying efforts consistently fail to break through, leading to false breakouts.
After retreating from these highs, DOT’s price has settled into a consolidation pattern, centering around $7.50. This level has seen multiple interactions, underscoring its significance as both a support and resistance point. Consequently, the $7.50 mark is pivotal, potentially determining DOT’s short-term direction.
Polkadot and Energy Web Forge Alliance for Eco-friendly Blockchain Innovations
The immediate resistance is at $7.50, aligning with recent highs and the consolidation area. Overcoming this level might pave the way for another attempt at the $8.00 resistance zone. Conversely, the first key support stands at $7.34, followed by more substantial support at $7.10 and $6.40. These levels are crucial for maintaining a bullish outlook. Notably, the chart highlights a “Third Target” at $6.115, a critical level if a bearish trend continues.
The Moving Averages (MA) plotted on the chart suggest an intermediate bullish trend. The price is above both the 50-period and 100-period MAs, hinting at bullish undertones in the medium term. However, the market’s volatility and the presence of fakeout zones indicate challenges for sustained upward movements.
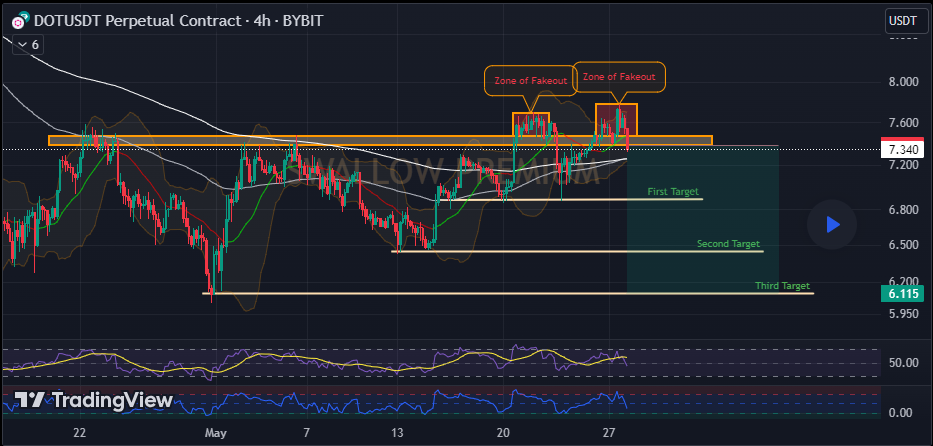
Technical indicators, such as the Relative Strength Index (RSI) and the Moving Average Convergence Divergence (MACD), provide further insights. The RSI is around the 50 level, indicating neutral momentum. This neutrality reflects a balance between buying and selling forces. The MACD shows a slight bullish crossover but remains near the baseline. This points to cautious optimism that requires further confirmation for a strong bullish signal.