
Polkadot ($DOT) currently stands at a critical point, teetering on a significant support level following its encounter with resistance. According to an analysis from CryptoCapo, a prominent analyst, the sustainability of this support could open the door for potential upward momentum towards resistance zones at $10-$11 and potentially $15-$17. These levels hold considerable importance, signifying significant milestones for the cryptocurrency’s trajectory.
Polkadot’s price journey has been marked by turbulence and promise in recent years. Starting in September 2020, cryptocurrency experienced a rapid surge, reaching its peak by mid-2021. However, following this peak, it underwent a significant correction, characterized by a succession of lower highs and lower lows, indicating a downtrend. Despite these challenges, the price stabilized around mid-2022, signaling the beginning of a recovery phase that has persisted since then.
Key support and resistance levels play a pivotal role in understanding Polkadot’s price movements. Currently, the primary support lies around $1.79, representing the foundation of the recent bullish turnaround. Additionally, $6.00 emerges as a critical support level, witnessing multiple attempts by the price to breach it.
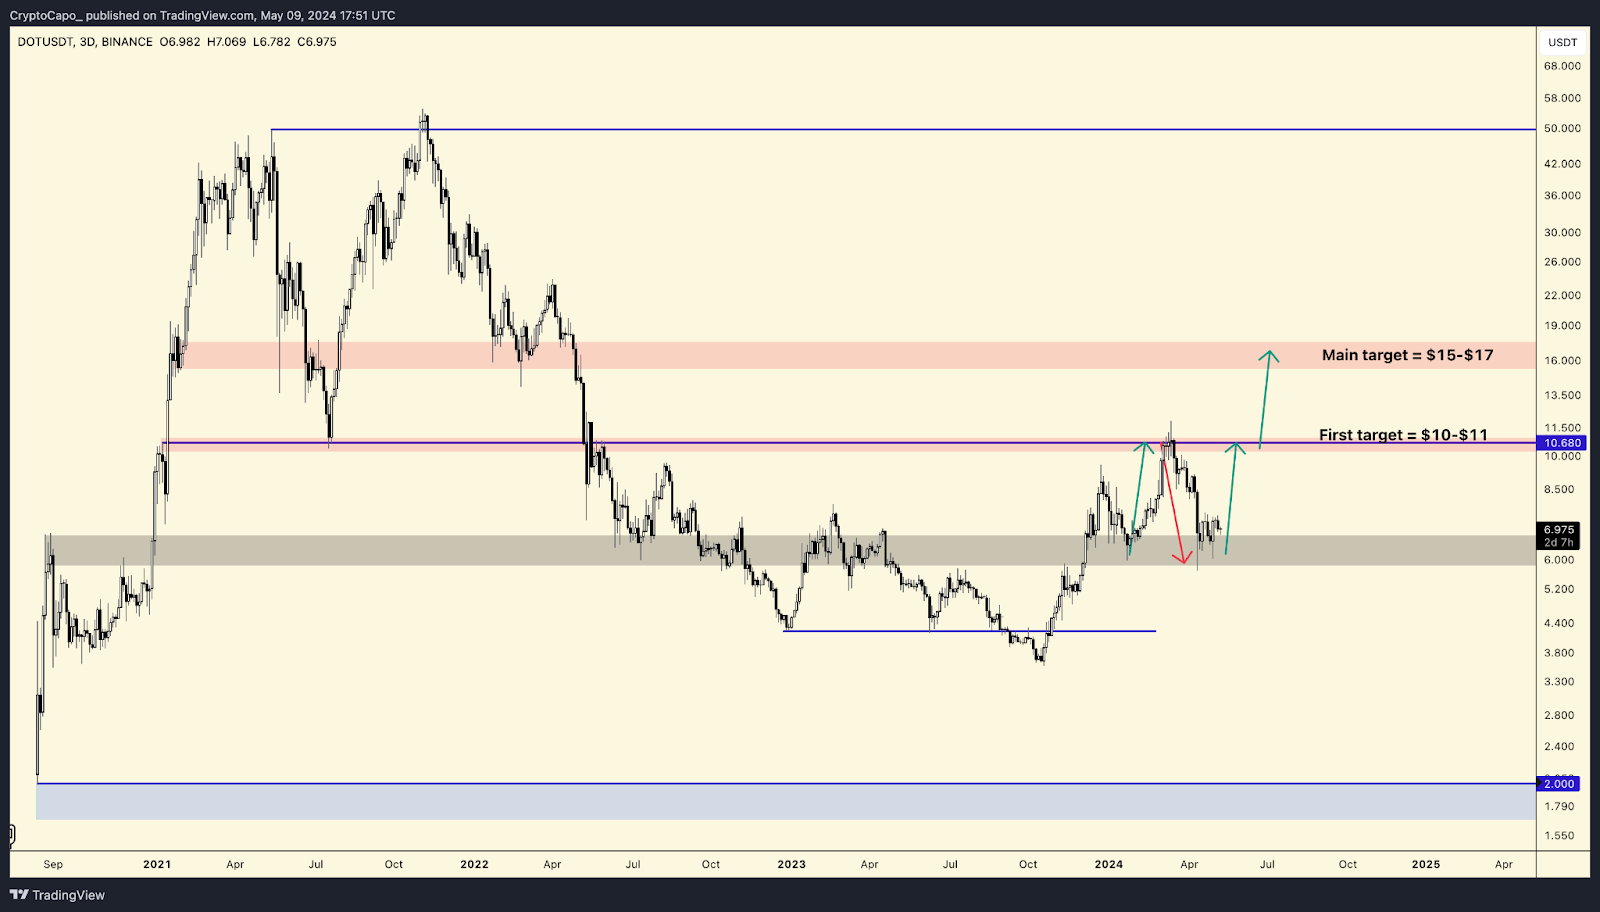
On the flip side, resistance levels pose challenges for Polkadot’s upward momentum. The $10-$11 range stands out as a significant resistance zone, having served as both support and resistance in the past. Beyond this lies the main target between $15 and $17, aligning with previous peaks and likely requiring substantial buying volume and positive market sentiment to breach.
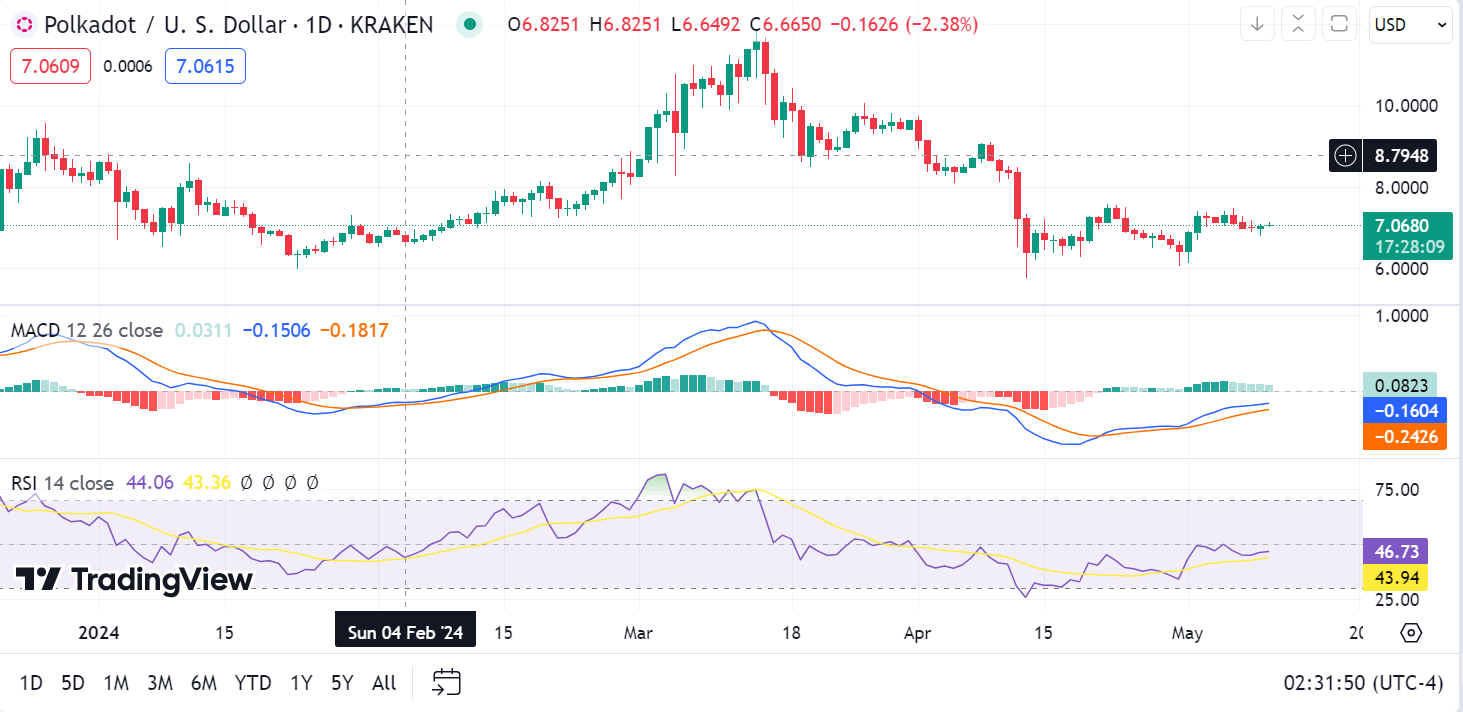
The live price of Polkadot today stands at $7.07, accompanied by a 24-hour trading volume of $170,707,380. The 1-day RSI indicates a potential buying opportunity as it approaches oversold territory, while the MACD suggests bullish momentum building. However, the 1-day KST trading below the zero line signals a bearish trend, warranting caution until a crossover above the zero line occurs.