
In a recent analysis of XRP’s monthly chart, analysts identified compelling evidence supporting the theory of a blow-off top in July. Notably, two points of contact breakout have already transpired, setting the stage for a potential third breakthrough.
Crypto analyst CoinsKid provided a chart analysis of XRP, highlighting the signals pointing towards a potential blow-off top.
Transitioning into July, market dynamics are poised for a crucial third point of contact breakout, underlining an intriguing development in risk appetite for XRP. This progression is supported by carefully examining the chart’s trajectory, emphasizing a consistent upward trend.
Moreover, the chart reveals the absence of passive movement, with each breakout indicating an active market response. Consequently, investors should closely monitor these trends, considering potential implications for their portfolios.
XRP is currently trading at $0.6226, showcasing a 1% gain on the daily chart. Over the past week, the digital asset has experienced substantial growth, fluctuating between $0.59 and $0.66. Maintaining robust support above $0.60, XRP is poised for a potential bullish rally. Recently breaking above $0.62, it now hovers around the $0.63 level.
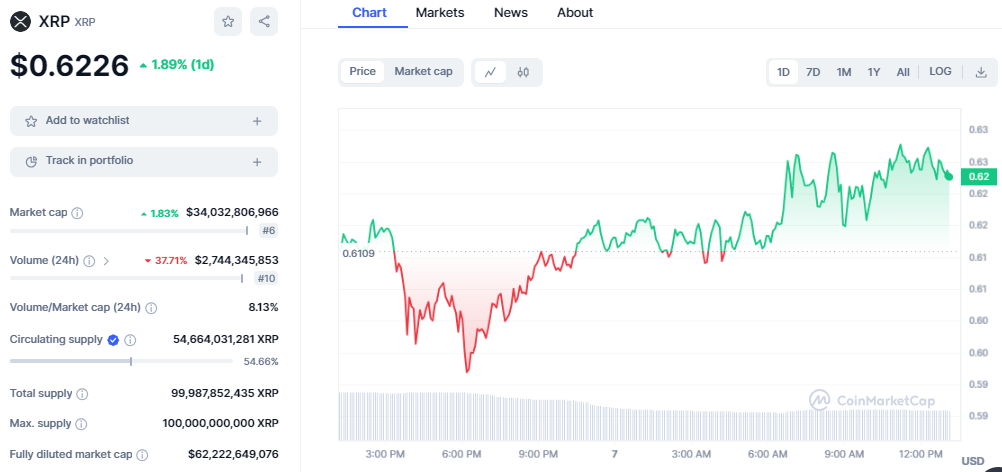
The immediate challenge for XRP lies at $0.63, with a successful breakthrough possibly propelling the cryptocurrency towards $0.64 and beyond. Further upward momentum could lead to significant milestones at $0.66 and potentially $0.68.
However, should XRP face resistance and fail to breach $0.63, a downside correction may occur. Initial support rests at $0.60, followed by a critical level at $0.58. A breach below $0.58 could trigger a substantial pullback towards $0.56, with the $0.54 zone serving as a key support.
Analyzing the technical front, indicators such as the Relative Strength Index (RSI) and Moving Average Convergence Divergence (MACD) suggest an uptrend for XRP. The MACD remains positive, with the MACD line above the signal line and green bars dominating the histogram.
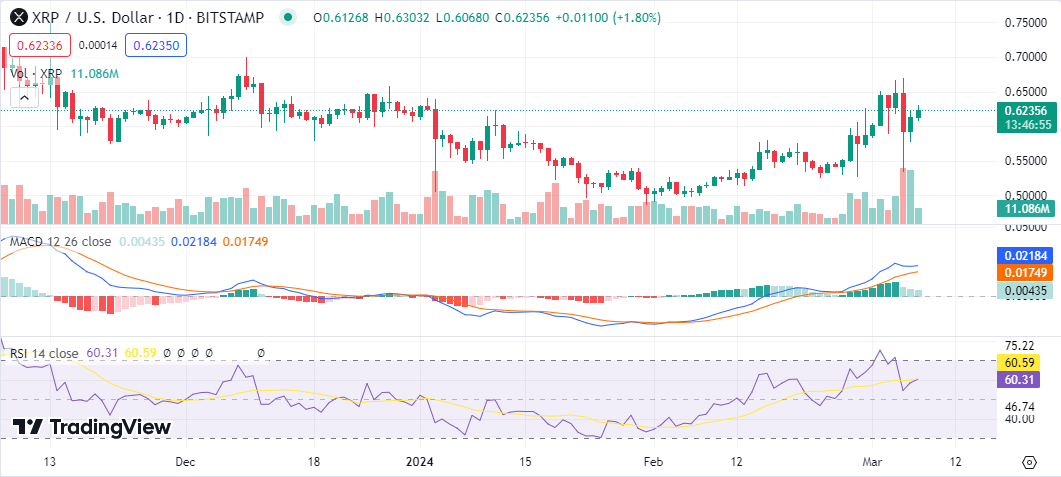
The RSI is climbing from the neutral level toward the overbought region, which is currently valued at a 60 index. Moreover, the 20-day Exponential Moving Average is below the current price, suggesting a buy signal in the XRP market.


