


- XRP’s historical volatility shapes its trajectory, with $2.4-$3 eyed as a conservative bull target.
- Support levels at $0.06 and $0.30, with resistance at $3.3, guide XRP’s market sentiment.
- Current consolidation around $0.50 signals balanced forces, with technical indicators hinting at short-term trends.
XRP is currently eyeing a conservative bull target for this cycle, ranging between $2.4 to $3, as per analyst MikybullCrypto. Analyzing its historical price movements reveals a pattern marked by significant volatility, with notable peaks and troughs shaping its trajectory over the years.
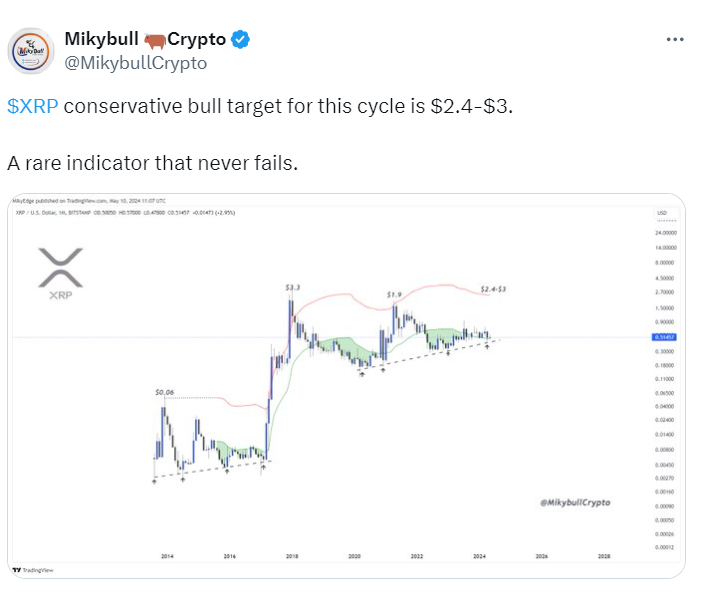
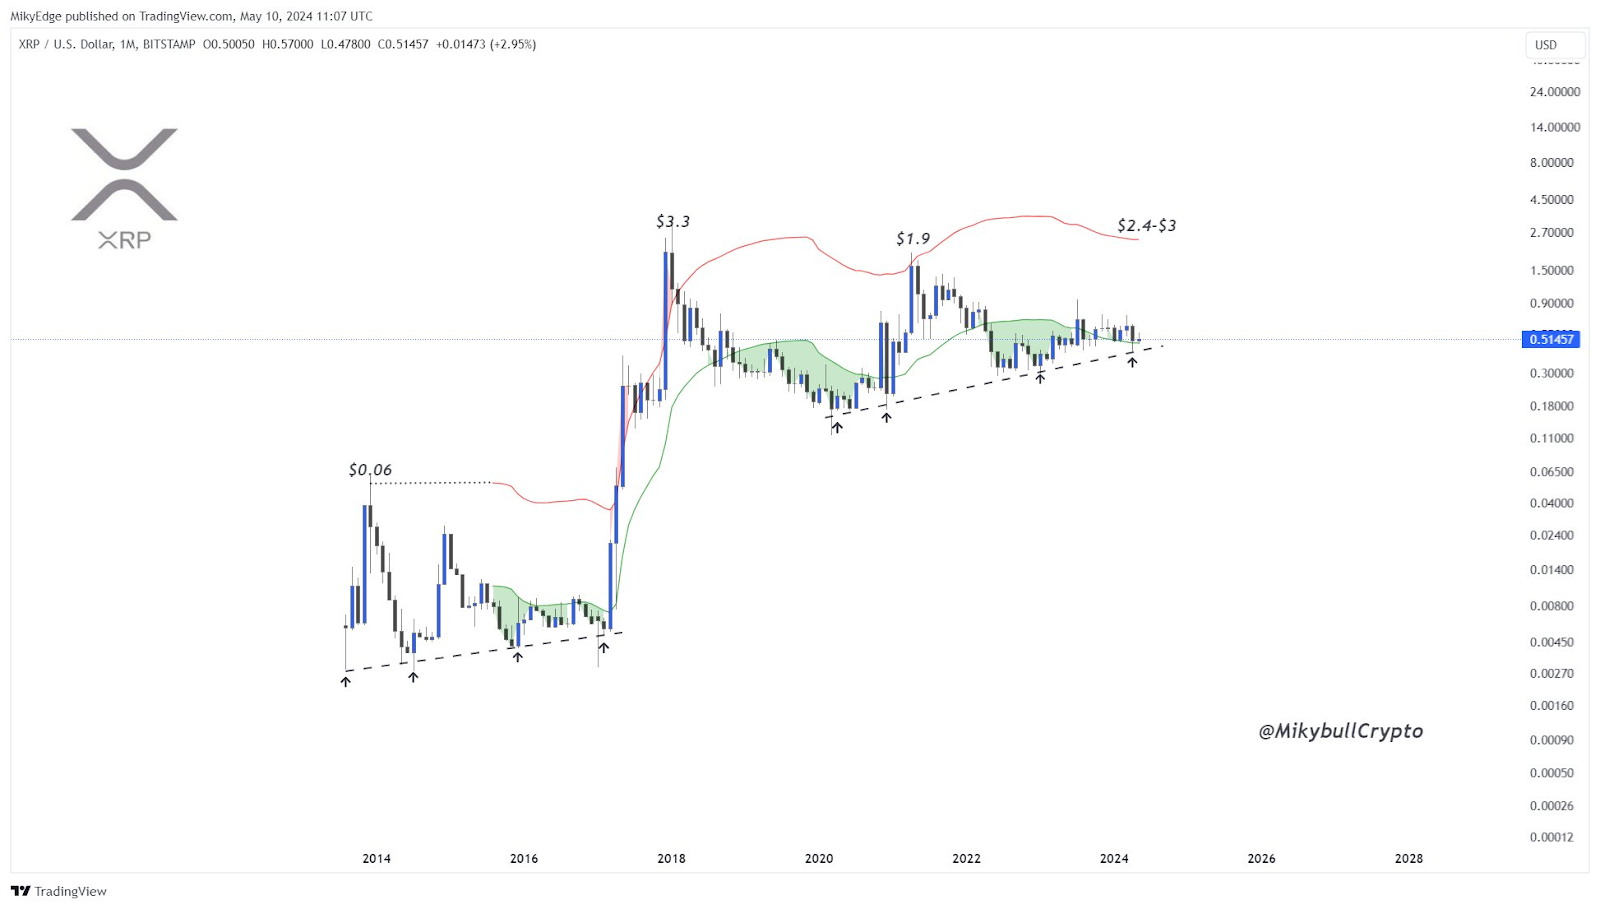
Since its inception with an initial low of around $0.06 in 2014, XRP has witnessed pronounced spikes, with the pinnacle being the peak near $3.3 in early 2018 during the cryptocurrency boom.
The subsequent period post-2018 saw XRP experiencing a general downward trend or sideways movement, punctuated by occasional upswings. Despite this, certain key support and resistance levels have emerged, providing insights into the market sentiment and potential price movements.
Notably, the $0.06 mark acted as a formidable long-term support level, establishing a base for XRP after its launch. Remarkably, the price never revisited this level after the initial spike, indicating a significant upward shift in investor sentiment during that period.
Recently, the $0.30 threshold has emerged as a critical support level for XRP. It has endured frequent tests by XRP’s price but has consistently held strong. This level serves as both a psychological anchor and a technical support for current market participants. Conversely, at $3.3, XRP faces its peak resistance, marking its historical high point. This price level acts as a significant psychological barrier for traders and investors in the market.
Intermediate resistance levels at $1.9 and the range of $2.4 to $3 have also proven significant, denoting areas where previous rallies have faltered, with selling pressure historically outweighing buying momentum.
Presently trading at $0.512484, XRP finds itself in a consolidation phase, trading within a narrow band around the $0.50 mark. This sideways movement suggests a balance between buying and selling forces, with the overlay of moving averages indicating a lack of strong momentum in either direction.

Despite this, indicators such as the 1-Day stochastic RSI trading below the signal line hint at a potential downward trend in the short term, while the 1-Day MACD trading above the signal line suggests some bullish momentum building up. The ADX reading of 17.33 further indicates relatively weak trend strength in the XRP market at the moment.


