- Dark Defender’s analysis indicates XRP completed its 5 Wave Corrective Structure, signaling a potential market shift.
- Critical support and resistance levels were identified at $0.5014 and $0.5286, with Fibonacci markers further outlining potential fluctuations.
- Oversold RSI and back-test patterns in XRP’s chart suggest a looming reversal in its price movement.
Renowned crypto analyst Dark Defender recently shed light on Ripple’s cryptocurrency, XRP. He shared insights that suggest a significant turn in its market behavior. The analysis points to a completed corrective structure, indicating that XRP might be gearing up for a noteworthy change.
The crypto’s journey has reached a crucial juncture. According to the analysis, XRP has finished its 5 Wave Corrective Structure, a key technical pattern. Consequently, this completion typically signals a shift in market dynamics. The cryptocurrency’s immediate support was pegged at $0.5014, while it faced resistance at $0.5286.
Moreover, the Fibonacci levels add another layer of intrigue to the asset’s trajectory. Support and resistance are marked at $0.4623 and $0.6649, respectively, presenting a broader spectrum for potential price action.
Adding to the mix is the Relative Strength Index (RSI) for XRP suggests an oversold condition. This often precedes a reversal in price trends. The break-and-back test pattern observed in the RSI further hints at this potential upward trajectory. Such technical indicators are crucial for investors tracking XRP’s performance. They offer a glimpse into the future direction of this digital currency.
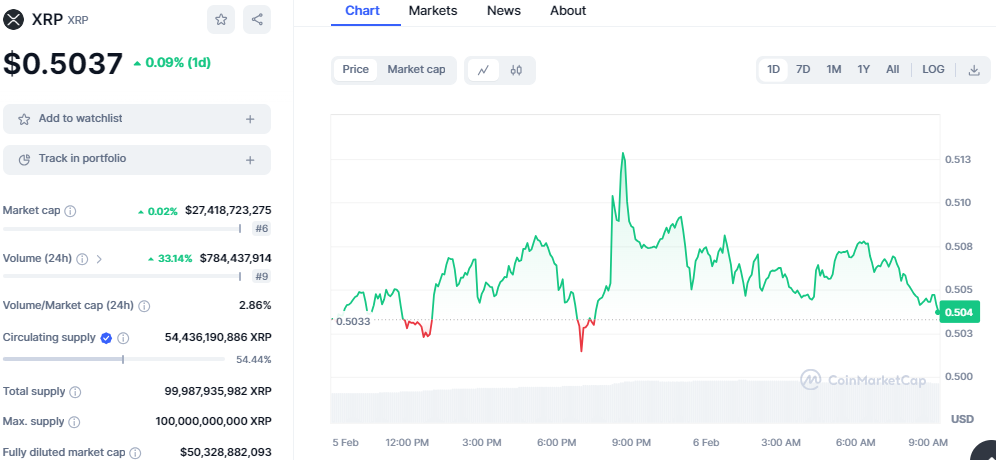
Looking at XRP’s outlook today, the digital asset is trading on a bullish note after a week of downtrend. XRP is exchanging hands at $0.5037, with a mere gain of 0.09% on the daily timeframe. Today’s bullish momentum has been backed by the increase in the daily trading volume, which has increased by 33%, climbing to $786 million. However, the market cap is on the increase, too, standing at $27 billion and positioning XRP at position 6, according to CoinMarket Cap data.

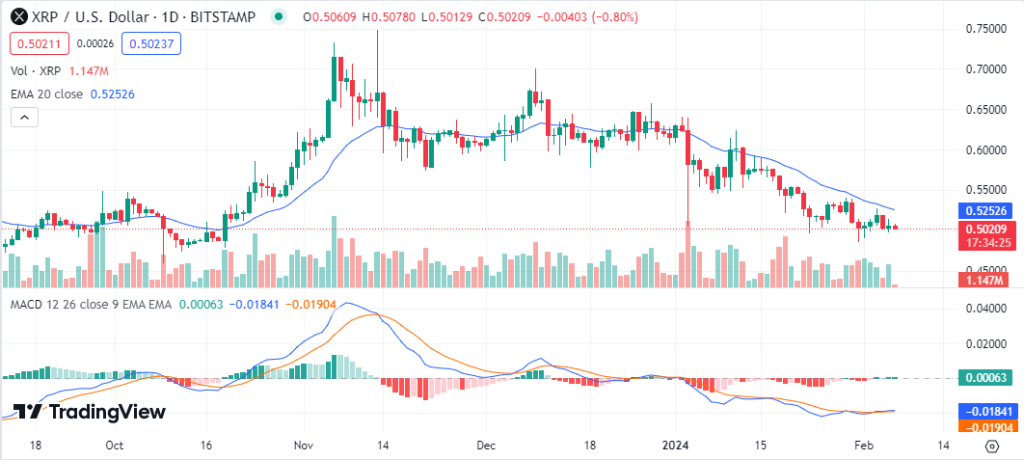
Technical indicators on the daily chart display a bullish reversal in XRP’s market. The Moving Average Convergence Divergence (MACD) indicator displays an increase in buying pressure as the histogram shifts from the negative territory as green bars form on the histogram. However, the 20-day EMA at $0.5255 indicates a sell signal as XRP faces stiff resistance at this point.

In conclusion, Dark Defender’s analysis brings a ray of hope for XRP enthusiasts and investors. The technical patterns and indicators highlighted in his recent update suggest that Ripple’s XRP could be on the cusp of a positive shift. While the crypto market is known for its volatility, such informed analysis provides a beacon for those looking to understand and anticipate its next move.


