In the dynamic world of cryptocurrency, XRP’s price movement is a subject of keen interest. Presently, it’s observed that XRP’s price is operating within the confines of a Descending Channel. This pattern is typically characterized by lower highs and lower lows, indicating a bearish sentiment in the market. However, it also opens the avenue for a potential breakout, a scenario eagerly anticipated by investors and traders.
EGRAG CRYPTO, a recognized enthusiast in the cryptocurrency sphere, recently disseminated insights via a Twitter post, highlighting the significance of XRP’s current positioning within a Descending Channel and its implications for potential market movements.
#XRP Shooting Start or GraveStone Doji!!! (Update):
— EGRAG CRYPTO (@egragcrypto) November 15, 2023
Let us Zoom IN to a 4-hour timeframe to comprehend the pinnacles of #XRP price action.
In my view, the #XRP price remains within the boundaries of the Descending Channel, and I expect it will persist in doing so until a… https://t.co/C8p3Jorxj8 pic.twitter.com/ATYRCi6uuU
These bearish candlestick formations suggest that XRP might retest its support levels before any significant upward movement. The expected retest points are between $0.50 and $0.55. Adding to the complexity is the theory of a 7-12% overshoot, which implies that the price may temporarily extend beyond the anticipated support or resistance levels before correcting its course.
However, this scenario is not a cause for alarm but a part of the larger strategic play in the crypto market. Such movements are integral for establishing strong foundational support for sustainable long-term growth. It’s a testing ground for the resilience and robustness of the price levels. The critical threshold to watch is the invalidation price target. If XRP’s price closes above $0.735 on a Daily, 3-day, or Weekly Candle, this would invalidate the current bearish outlook. Such a move could signal a shift in market sentiment and potentially herald the beginning of a new bullish phase.
Over the past few days, bears have been in charge of the market, demonstrating a tight grip on XRP’s price. This has resulted in forming the Descending Channel pattern, indicating bearish momentum. Over the past seven days, XRP has decreased by 9.2%, with selling pressure persistently outweighing buying pressure. This has resulted in XRP’s price hovering around the $0.60 level, a critical support level.
Today’s price action suggests that XRP’s price is currently testing the support level at $0.60, with a possibility of bouncing back if it holds. However, if this support level is broken, bears may continue to push the price lower towards the previously mentioned retest targets. However, if bullish pressure starts to outweigh bearish sentiment, XRP’s price could break out of the Descending Channel and move toward the next resistance levels at $0.65 and $0.70.
At the time of writing, XRP ‘s price is trading at $0.6065, with a 24-hour decrease of 0.95%. The overall market sentiment is still leaning towards bearish, with Bitcoin and Ethereum also experiencing price decreases. The current market capitalization of XRP stands at $32 billion, making it the 5th largest cryptocurrency by market capitalization. The 24-hour trading volume for XRP is $1.2 billion, indicating significant trading activity and potential price movements.
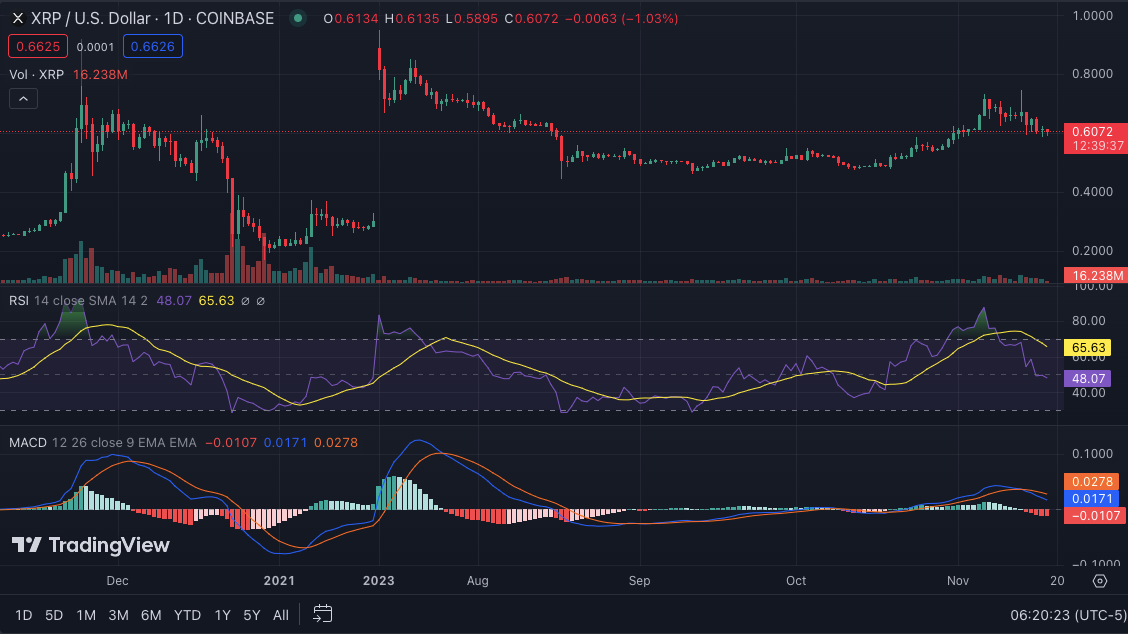
The technical indicators also support the current bearish sentiment. The Relative Strength Index (RSI) is below 50, indicating selling pressure outweighs buying pressure. The Moving Average Convergence Divergence (MACD) has also formed a bearish crossover, with the signal line crossing below the MACD line. The histogram also shows an increase in red bars, indicating a strengthening bearish momentum. The 20-EMA and 50-EMA are trending downwards, further supporting the bearish sentiment.