3 Reasons XRP Looks Ready To Break the Support at $2

- XRP forms lower highs as resistance near $2.60 keeps rejecting every rally attempt.
- Indicators show weak momentum with RSI at 39 and MACD holding firmly in the negative range.
- Long liquidations rise, and open interest drops sharply, signaling fading market confidence.
XRP has spent months sending out clear signs that its chart is under strain. A broad bearish formation that first surfaced in early August is still shaping the market, guiding the price lower and limiting every rally attempt.
The longer this structure holds, the more it reveals a market losing drive and showing little strength on the upside. Since the pattern has not broken, the broader trend continues to lean toward softness in the coming months.
As of press time, nothing in the larger setup has shifted yet, and the pressure on the price remains visible. Even so, the latest movement on the chart now points to three notable factors that place XRP closer to a potential move beneath the $2 region. Here is a closer look at the key drivers shaping this critical moment.
Downtrend Pattern Tightens as XRP Loses Higher Levels
XRP has recorded a steady line of lower highs from August through November, with each rebound fading faster than the last. Every attempt to climb has met early resistance, showing sellers continue to step in at every bounce. This behavior reinforces the broader downtrend that first appeared in July and has carried into the final months of the year.
The market has shown little buying strength during this period, and the structure remains firmly intact. The rejection near $3.10 added another clear point to the pattern, confirming the upper boundary of the descending imprint. That turn kept XRP locked inside a formation visible across several timeframes.
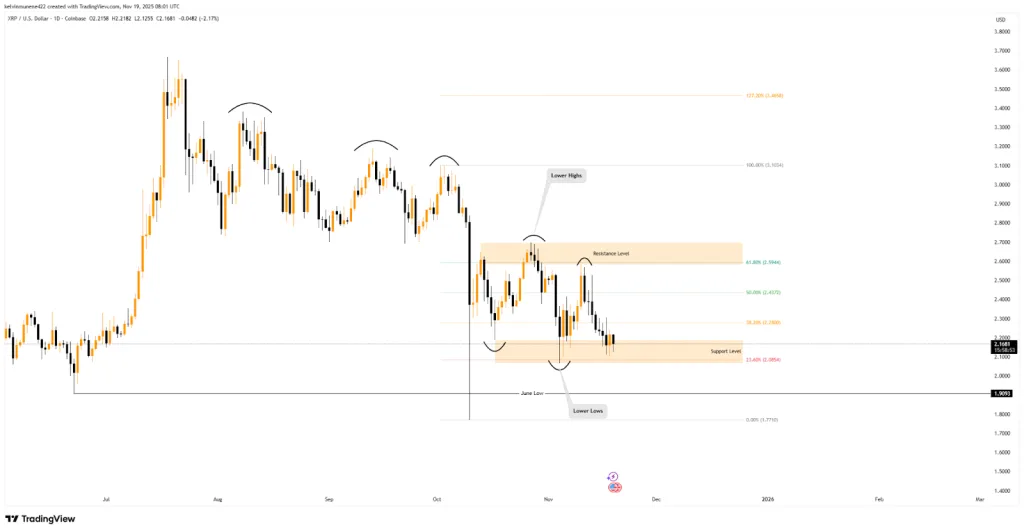
The price has also struggled to break the $2.55–$2.60 region, which aligns with the 61.8% Fibonacci retracement. Every approach toward this zone has ended in a reversal, highlighting weak demand at higher levels.
On the lower side, XRP continues to retest the $2.05–$2.15 support area. Buyers have managed to hold it so far, but repeated tests often weaken a support zone. The frequency of these retests suggests the base beneath XRP is becoming less stable as pressure builds around the $2 mark.
Indicators Lean Bearish as Sellers Hold the Lead
Momentum readings offer the second major signal. Currently, XRP trades well below the 50-day and 200-day moving averages, sitting at $2.49 and $2.63. Besides, the 50-day MA slopes downward, while the 200-day MA trends sideways, both signaling the absence of any reversal.
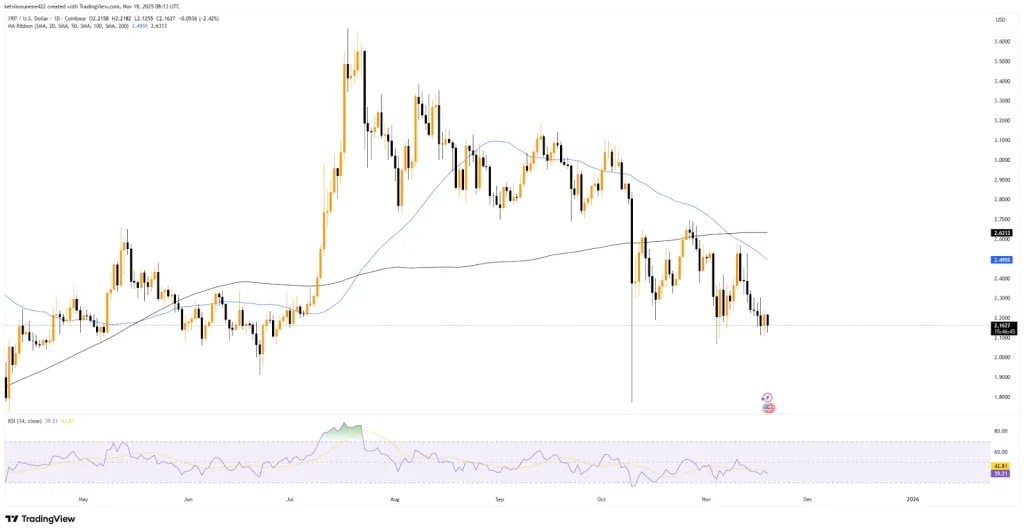
Multiple rejections at the 50-day MA reinforce the broader pattern of seller control. Other indicators, such as RSI, also sit at 39, highlighting weak buying strength and continued seller dominance. The indicator has remained below the 50 midpoint for weeks, a sign that upward momentum remains absent.
Similarly, MACD trades below the signal line with negative histogram bars, showing ongoing bearish pressure. Combined with RSI, the MACD confirms that bulls lack the strength needed to lift XRP from support.
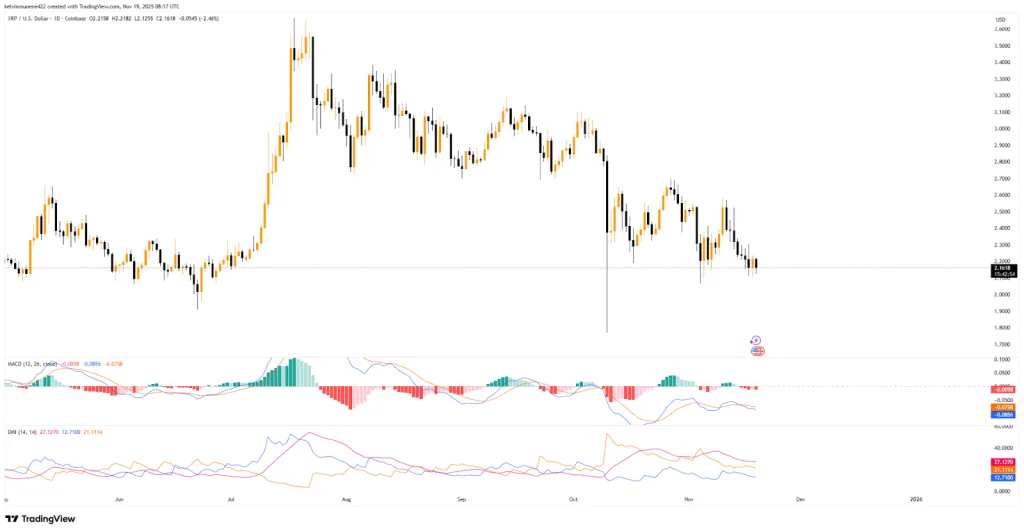
The DMI reinforces this structure. The -DI sits at 21, above the +DI at 12, confirming bearish dominance. Unless +DI overtakes -DI soon, downward pressure remains the likely direction.
Liquidations Rise and Participation Drops Across XRP Markets
On-chain and derivatives data offer the third and most immediate concern. According to CoinGlass data, more than $5 million in long positions were liquidated over the past 24 hours, compared with only $1.25 million in short liquidations.
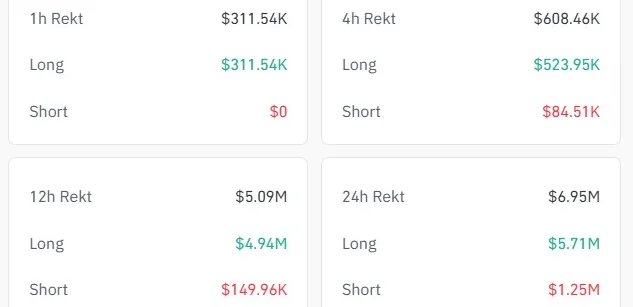
That imbalance represents a clear long squeeze, where bullish traders are forced out of positions during price drops. This usually adds fuel to downward moves as forced sales create additional pressure.
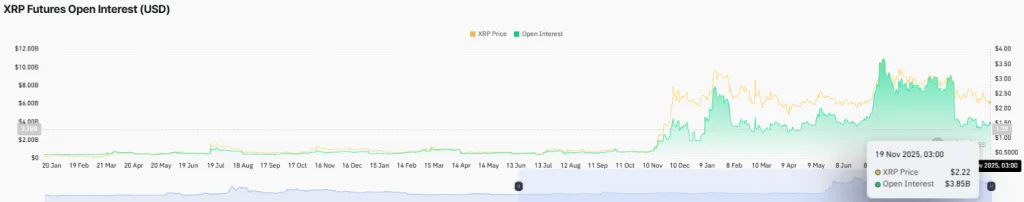
Open interest paints a similar picture. After reaching a record high of roughly $10.94 billion, XRP’s total open interest has fallen to about $3.85 billion. Such a steep decline shows that many traders have exited entirely, leaving fewer participants willing to hold through volatility. Drops of this scale often reflect fading confidence in the short-term structure.
Related: HYPE Tightens Range as On-Chain Data Hints at $45 Breakout
Key Levels Ahead
With these factors combined, XRP sits in a vulnerable position. The immediate support zone at $2.18–$2.06 remains the final barrier before June’s $1.90 low. A confirmed break could open the path toward deeper Q4 levels, including the $1.77 region.
However, if the current support holds, XRP would need to reclaim the 38.2% Fibonacci level at $2.28 to show early signs of recovery. Above that sits the 50% fib at $2.43, followed by the 61.8% retracement between $2.50 and $2.60, the same zone that rejected previous rallies.
For now, the data points overwhelmingly toward the downside, and the $2 line is the next major threshold to watch.