$425M in Solana Moves — Whale Shuffle or Exchange Play?

- Over $425M in Solana moved in 30 minutes, leading to speculation.
- ETF inflows exceed $700M, showing rising institutional exposure to Solana’s network.
- SOL trades at $186 as mixed flows and technical pressure weigh on the short-term outlook.
Over 2.3 million Solana tokens worth about $425 million were moved across multiple wallets in less than 30 minutes on November 1. According to Whale Alert, part of the transfers went to Coinbase, while the rest circulated between unidentified wallets. The motive behind these transactions is uncertain, raising speculation of a whale shuffle or an institutional liquidity rotation.
Whale Transfers and Ongoing Speculation
Whale Alert spotted several huge Solana (SOL) transfers, including two moves of about 833,351 SOL each — roughly $156 million — between unknown wallets. It also noted three other transactions of around 308,517 SOL each, worth about $57.7 million, sent from unknown wallets to Coinbase.
These kinds of large transfers often signal possible big market shifts. It’s not yet clear if the moves suggest plans to sell or just a reshuffling of staked tokens, but the timing and coordination look similar to past moments of price volatility before market changes. The timing has drawn attention, especially as Solana’s spot ETFs continue to attract institutional inflows in the U.S.
Related: Bitwise Solana ETF Sees $57.9M First-Day Surge
ETF Inflows and Network Activity
Bitwise’s Solana ETF (BSOL) reported a single-day inflow of $44.48 million, with total net inflows reaching $197 million. Combined with the REX-Osprey Solana and Staking ETF (SSK), both funds now manage over $700 million in assets.
This points to growing interest in Solana from big investors, even though regular traders still have mixed feelings. The Solana network itself is very active, handling about 70 million transactions every day and around $143 billion in monthly trading volume on decentralized exchanges.
It runs on 1,295 validators spread across 40 countries and has a Nakamoto Coefficient of 20, showing decent decentralization. The network now processes about 1,100 transactions per second.
These upgrades included better stake-based traffic control, early testing with the Firedancer client, and tweaks to how validators earn rewards. Network congestion dropped a lot after these changes. Still, Solana’s fee system is local, so users sometimes end up paying more or less than they should based on network activity.
Market Flows and Price Action
Exchange netflow data show alternating phases of inflows and outflows between mid-September and early October, with strong green spikes of $60 million to $90 million during price ranges of $240–$260.
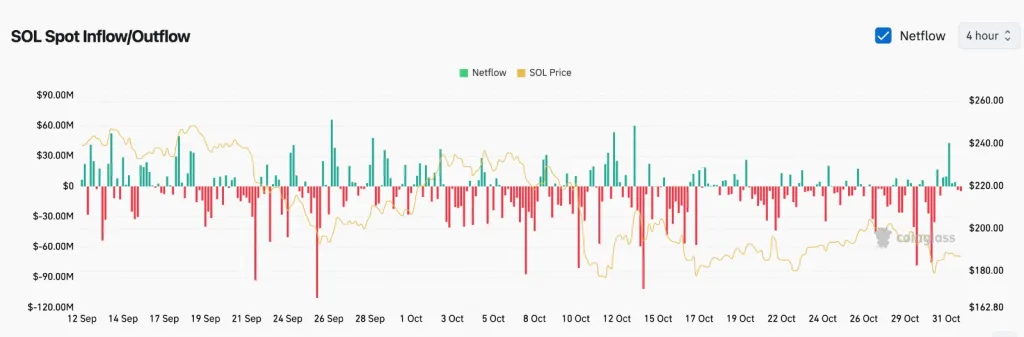
Source: Coinglass
However, after October 5, heavy outflows, often exceeding $60 million, coincided with a drop from $240 to around $180, suggesting strong profit-taking and liquidity movement. In late October, Solana saw a brief recovery as about $80 million flowed in, pushing its price close to $220 before money started leaving again.
This trend shows the market is still under pressure, with traders moving their SOL off exchanges—possibly to sell or adjust their holdings. If the outflows continue, the price could drop back to around $170–$180. But if more than $50 million flows back in, Solana might bounce again toward $220–$240.
Liquidations also highlight the market’s instability. In the last 24 hours alone, about $5.9 million worth of positions were wiped out, all from perpetual futures trades.
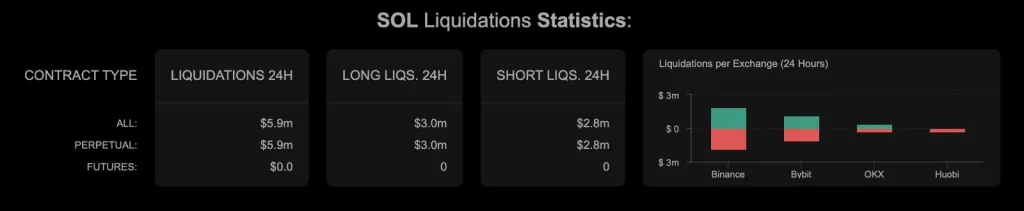
Source: Coinalyze
Longs accounted for $3 million, while shorts saw $2.8 million, showing balanced pressure on both sides. Binance led activity with about $3 million in combined liquidations, followed by Bybit and OKX.
Technical Outlook Shows Mixed Momentum
Between early May and late June, SOL stayed mostly below its 50-day moving average, suggesting the market was in a consolidation phase. In mid-July, momentum shifted slightly as the 50-day average started rising toward the 200-day average, signaling a possible bullish trend forming. That momentum pushed prices past $220 by late August, confirming a golden cross and attracting renewed investor attention.
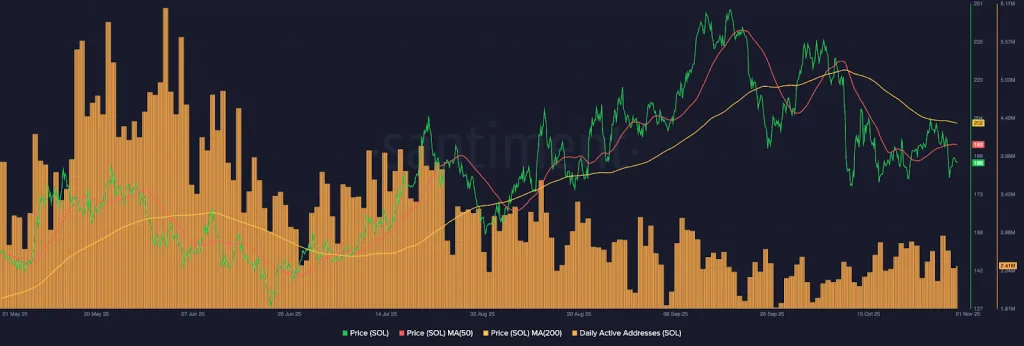
Source: Santiment
However, the October decline from $240 to $185 changed the trend. The 50-day MA has now dipped below the 200-day MA, showing potential downside pressure. Active addresses have also fallen to about 2.4 million, indicating reduced participation.
If network activity recovers and the 50-day MA rises again, Solana could reclaim the $200–$204 range, supporting a bullish continuation. However, sustained weakness below $190 may lead to further correction toward $175.
The $425 million in synchronized Solana transfers shows growing uncertainty in market sentiment. With major ETF inflows, whale movements, and cooling network activity unfolding simultaneously, the market appears to be balancing between accumulation and distribution phases. Whether these transfers reflect strategic repositioning or early sell pressure, upcoming price action around the $180–$200 range will be important.