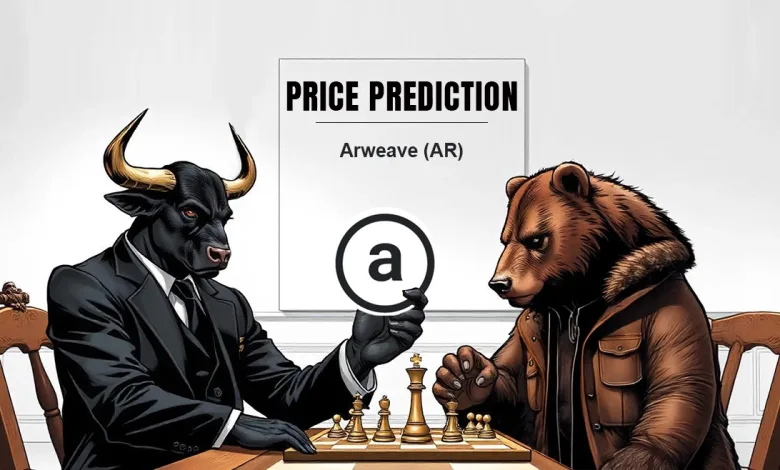
Arweave Price Prediction 2025-35: Will It Hit $300 by 2035?
- Market sentiment leans cautiously bullish as price holds steady above the historical support range.
- On-chain data reveals Open Interest hit $153M before cooling to $36M amid low speculation.
- AR could climb to $60 in 2025, supported by post-BTC halving hype and rising storage demand.
Arweave (AR) Overview
| Cryptocurrency | Arweave |
| Ticker | AR |
| Current Price | $6.87 |
| Price Change (30D) | +3.37% |
| Price Change (1Y) | -84.12% |
| Market Cap | $450.89 Million |
| Circulating Supply | 65.65 Million |
| All-Time High | $90.94 |
| All-Time Low | $0.4854 |
| Total Supply | 65.65 Million |
What is Arweave (AR)?
Imagine a blockchain that doesn’t just store transactions but forever preserves entire websites, documents, apps, and digital history. That’s Arweave. Arweave (AR) is a decentralized storage protocol that enables permanent data storage—forever—on a blockchain-like structure called a blockweave.
Unlike traditional storage networks, where data disappears when users stop paying, Arweave introduces a pay-once, store-forever model. Fueled by its native cryptocurrency, $AR, this ecosystem ensures that once data is uploaded, it’s there to stay—immutable, accessible, and censorship-resistant.
And it’s not just storage. Arweave is the foundation of the permaweb, a permanent and decentralized version of the Internet where anyone can build and access unstoppable apps, pages, and archives—backed by a vibrant ecosystem and a growing community.
How Arweave Works – Beyond the Blockchain
Arweave is not your average blockchain—it’s a block weave, a more complex and efficient system tailored for data permanence.
- Blockweave Structure: Instead of a linear chain like Bitcoin, Arweave connects each new block to two earlier blocks—its direct predecessor and a randomly selected “recall block.” This boosts redundancy, speeds up validation, and helps ensure that old data remains accessible.
- Proof-of-Access (PoA): A unique consensus mechanism that rewards miners only if they can prove they’re storing specific historical data. This aligns incentives toward long-term data preservation, not just transaction validation.
- Succinct Proofs of Random Access (SPoRA): Enhances efficiency and ensures miners retrieve past data randomly and accurately, reinforcing decentralization and data integrity.
- Content Moderation: Each node decides what type of content it wants to store, allowing flexibility while still contributing to the network. Miners storing high-demand or resource-intensive content are rewarded more generously.
Key Features
Arweave isn’t just a tech protocol—it’s a thriving, self-sustaining ecosystem powered by the AR token.
- AR Token Utility:
- Pay once in $AR to store data permanently.
- Earn $AR through mining by storing and serving data.
- Tradeable on major exchanges like Binance, increasing liquidity and adoption.
- Sustainable Endowment:
- A portion of AR fees goes into an endowment, funding the network’s operations and ensuring longevity without recurring costs.
- Bundling:
- Multiple transactions are grouped into a single layer-1 transaction, boosting scalability and reducing costs.
- Decentralized Permaweb:
- Developers can build fully decentralized applications that live forever on the Arweave permaweb—no central servers, no downtime.
- AR.IO & AO Network:
- AR.IO acts as a decentralized gateway infrastructure, powering fast access and indexing on the permaweb.
- The AO Network serves as a decentralized computation layer built on Arweave, enabling scalable on-chain computing. It utilizes the $AO token, a fairly issued and deflationary token, to reward contributors, pay for services, and power decentralized applications.
Arweave Price History
Arweave’s journey through the crypto markets reads like a rollercoaster thriller—fast climbs, sudden drops, and dramatic rebounds. It all began with a fiery ascent: after its launch, AR rocketed to $44.37 by mid-2021, only to be met by a powerful wall of resistance.
The excitement quickly cooled as the token tumbled into the $7.22–$2.35 range, a zone that would become more than just a floor—it would become a launchpad. AR defied the odds from this crucial support, surging over 1,100% to reach an all-time high of $90.94, marking one of the most impressive runs in its price history.
But the euphoria didn’t last. A powerful correction followed, dragging the price down over 95% back to its historic support zone. That support again sparked a bullish bounce, driving AR back to $49.51, where it collided with the 50% Fibonacci level, acting as a key resistance.

Unable to break through, the token reversed and now rests again on its familiar support range. Zooming out, AR has formed a descending triangle—a technical pattern that often signals bearish continuation. If support fails, the token could plunge to its all-time low or lower in extreme scenarios. But history has shown this zone is no pushover.
If AR manages to hold this level, it could see a repeat of past reversals, possibly catapulting the token toward the $45–$49 resistance zone. A clean breakout above that could open the gates for a return to its ATH around $94.
From Hype to Hesitation: Open Interest in AR Falls Quiet
Over the past year, AR’s Open Interest has experienced a significant decline. After peaking around $153 million during heightened speculation and volatility periods, OI has steadily fallen alongside price action. As of press time, it sits at approximately $36 million today, a far cry from its euphoric highs.

This drop in OI signals a notable reduction in leveraged positions, suggesting that traders are becoming more cautious, or possibly sidelined, awaiting clearer direction. Lower OI can often precede a major price move, as it indicates that speculative excess has been cleared out, making room for fresh momentum.
What’s compelling is that this decline in OI aligns with price compression within the descending triangle pattern. It paints a picture of a market in consolidation, not capitulation. Traders may be holding their breath, not fleeing, waiting for confirmation of a breakdown or a reversal from this historically strong base.
Related: Portal Price Prediction 2025-35: Will It Hit $50 by 2035?
Yearly Highs and Lows of Arweave
| Year | Arweave Price | |
| High | Low | |
| 2024 | $49.5159 | $7.5025 |
| 2023 | $13.7964 | $3.7464 |
| 2022 | $68.5245 | $6.0998 |
| 2021 | $90.9400 | $2.4631 |
| 2020 | $7.5932 | $0.4854 |
Arweave Technical Analysis
The MACD for Arweave (AR) is firmly in bearish territory, with the MACD line sitting at -1.8632, well below the signal line at 0.3704. This is reinforced by the red histogram bars, which have been expanding steadily, indicating a growing bearish momentum in line with the recent price decline.

These technical signals highlight ongoing downside pressure and weak short-term momentum, aligning with the trend of persistent resistance. Complementing this bearish outlook, the Relative Strength Index (RSI) stands at 43.64, favoring the bears.
This level places RSI below the neutral 50 threshold, signaling a lack of buying pressure and tilting the bias toward continued selling. The RSI has been on a steady downward trajectory since its 2024 peak, mirroring AR’s inability to break key resistance levels and reflecting reduced investor enthusiasm.
Arweave (AR) Price Forecast Based on Fair Value Gap
The Fair Value Gap (FVG) on Arweave’s monthly chart currently ranges between $12.34 and $8.99, just above the token’s price of $7.30. This FVG acts as a magnet for price, signaling a potential upside move if bulls reclaim momentum.
Historically, price tends to revisit and fill these imbalances, especially when aligned with long-term support zones, precisely the scenario AR is facing now. The FVG zone was formed after a sharp move down from the $12 range in early 2025, creating a gap where little to no price action occurred.

This suggests a liquidity void, and the market may seek to rebalance by pushing the price back into this zone. This becomes even more compelling considering AR is hovering near a historically strong support region, where previous bullish reversals were initiated.
If AR mounts a bounce from current levels, the $8.99–$12.34 FVG will likely serve as the first target zone for price recovery. Conversely, failure to reclaim this range could confirm bearish continuation and invalidate the potential gap fill.
Arweave (AR) Price Forecast Based on MA Ribbon Analysis
Arweave (AR) remains technically bearish, with the 20-month moving average (MA) at $18.79 sitting below the 50-month MA at $20.09. This configuration confirms a death cross on the monthly timeframe—a strong bearish signal that typically suggests continued downward momentum or a prolonged consolidation phase.
The current price of $7.28 is trading well below both the 20 and 50 MAs, reinforcing the token’s weakness relative to its historical trend. This distance from the moving averages indicates that AR is under significant selling pressure, and a reversal would require a sustained breakout above both levels.

So far, there’s little evidence of that happening, with price consistently closing below the ribbon. As long as the 20 MA remains beneath the 50 MA and price stays suppressed, upside attempts may be limited or short-lived.
Until AR can reclaim and maintain levels above $20.09, the MA ribbon continues to serve as dynamic resistance, limiting bullish advances and reinforcing the broader bearish trend across higher timeframes.
Arweave (AR) Price Forecast Based on Fib Analysis
Arweave (AR) is trading well below the 23.6% Fibonacci retracement level at $21.83, signaling the token is still deep in a corrective phase. This position highlights strong overhead resistance and AR’s challenges in mounting a sustained recovery.
The first major resistance lies at the 23.6% ($21.83), which marks a critical hurdle. Reclaiming this zone would be AR’s initial signal of strength and a potential shift in market sentiment. Above that, the 38.2% level at $35.03 and the 50% level at $45.71 act as more significant resistance zones. These areas have historically aligned with strong price reactions and would likely attract profit-taking and fresh interest from bulls if reached.

The 61.8% Fibonacci level at $56.39—often called the “golden ratio”—represents a pivotal point where a confirmed trend reversal could be validated. The final major resistance is the 78.6% level at $71.58, just beneath the all-time high of $90.94.
Regarding support, AR’s price suggests it is testing macro lows, with the Fibonacci anchor at $0.48 representing the cycle’s base. Unless AR breaks above $21.83, it remains technically bearish within the Fib framework.
Arweave (AR) Price Prediction 2025
AR could surge between $1 and $60 in 2025, fueled by post-halving hype and AO ecosystem growth. Renewed investor demand and utility could drive it past its previous barriers, before facing resistance from profit-taking and market saturation.
Arweave (AR) Price Prediction 2026
In a typical correction year, AR may retrace sharply from its highs, dropping into the $20 to $50 range. Market euphoria fades, leading to lower valuations, tighter liquidity, and widespread caution across speculative altcoins.
Arweave (AR) Price Prediction 2027
AR could consolidate between $5 and $30 as the market bottoms. Accumulation begins, driven by hope for a rebound, with support from ecosystem development, data storage demand, and upcoming BTC halving anticipation.
Arweave (AR) Price Prediction 2028
With renewed optimism, AR may slowly recover toward $55 to $100 in 2028. Growth in NFTs, DePIN, and decentralized apps supports the uptrend, while market confidence builds amid the fifth Bitcoin halving event.
Arweave (AR) Price Prediction 2029
AR could rise between $80 and $150 during a new bull cycle, backed by the AO supercomputer, permaweb adoption, and Web3 expansion. Investors return in force, pushing prices toward key resistance zones.
Arweave (AR) Price Prediction 2030
As markets correct, AR might drop to $60–$120, mirroring post-bull-cycle retracement. Profit-taking, regulation, and cooling hype limit upside, while long-term fundamentals support the ecosystem’s core growth.
Arweave (AR) Price Prediction 2031
AR may stabilize and recover in the $70 to $140 range. Investors regain confidence, and ecosystem maturity brings steady growth. Integration with other chains and storage use cases enhances token value.
Arweave (AR) Price Prediction 2032
AR could rally to $110–$200 in 2032, fueled by BTC’s halving. Increased demand for permanent storage, rising AI data use, and improved network infrastructure support strong momentum.
Arweave (AR) Price Prediction 2033
In 2033, post-halving expansion may drive AR to $160–$250, with new investors and institutions entering. High speculation and strong use cases combine, pushing prices into uncharted territory with sustained volume.
Arweave (AR) Price Prediction 2034
In 2034, correction sets in after overvaluation, sending AR into the $140–$220 range. Despite pullbacks, core usage and institutional interest maintain its long-term bullish trajectory and protect key support zones.
Arweave (AR) Price Prediction 2035
Anticipation of the 2036 halving may lift AR to $200–$300 in 2035. Regulatory clarity, mass adoption, and AO performance drive growth, helping the token reach new all-time highs and solidify its role in Web3 infrastructure.
Related: COTI Price Prediction 2025-35: Will It Hit $10 by 2035?
FAQs
AR is the native token of Arweave, a decentralized storage protocol designed to store data permanently using a unique blockchain structure called blockweave.
Depending on the platform’s supported trading pairs, you can buy AR on major cryptocurrency exchanges like Binance using other cryptocurrencies or fiat currencies.
AR offers long-term utility in decentralized data storage. It’s promising, but like all cryptocurrencies, it carries risk and requires thorough research before investing.
Store AR in a hardware wallet like Ledger or a secure software wallet that supports Arweave to ensure safety from online threats and unauthorized access.
Sam Williams, a computer science PhD dropout with a background in distributed systems and data storage technologies, and William Jones founded Arweave.
Arweave launched in 2018, introducing its permanent storage solution and the concept of the permaweb powered by its native AR token.
AR’s circulating supply of 65.65 million tokens matches its total supply, as no more tokens are expected to be minted.
If adoption increases and ecosystem growth continues, AR could surpass its all-time high of $90.94 during future bullish market cycles.
AR’s all-time low is $0.4854, recorded in 2020 before its rapid growth and entry into mainstream blockchain adoption discussions.
AR is forecasted to range between $1 and $60 in 2025, driven by post-BTC halving momentum, AO ecosystem expansion, and increased data storage demand.
By 2028, AR could trade between $55 and $100, recovering on halving optimism, rising NFT usage, and the need for permanent data infrastructure.
In 2030, AR may fluctuate between $60 and $120, reflecting market correction trends post-bull run, while maintaining strength due to fundamental long-term utility.
The 6th BTC halving could boost AR from $110 to $200, fueled by AI data growth, strong demand, and ecosystem maturity.
AR may hit $200 to $300 in 2035, driven by Web3 adoption, AO’s scaling, and anticipation of the 2036 BTC halving event.