BONK Price Eyes Recovery as Token Burn Fuels Optimism

- BONK nears one million holders as a one trillion token burn edges closer to becoming reality.
- Price holds firm at the 23.60% Fib retracement near $0.00002069 while testing consolidation
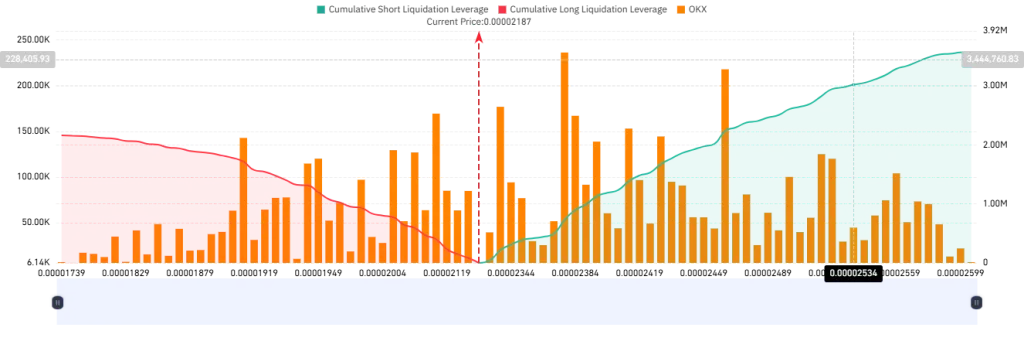
- Over $3.57M in shorts face exposure above $0.00002604, signaling risk of a possible squeeze
BONK is showing fresh signs of recovery after a 25% decline this month. The token has jumped more than 6% in the past 24 hours, now trading near $0.00002192. This turnaround comes as BONK’s development team plans to burn one trillion tokens, about 1.2% of the circulating supply, once the number of holders reaches one million. As of August 26, the figures were close to 975,000, putting the milestone within reach.
Token burns often create scarcity, helping reduce sell pressure and driving up investor optimism. Institutional support is also adding weight to the rally. Safety Shot, a wellness company, announced a $25 million BONK treasury allocation.
The move highlights growing confidence in the token’s long-term potential and signals an essential step in mainstream adoption. Still, BONK has ground to cover. The token has yet to erase the losses from August’s sell-off, where its value fell by more than a quarter.
Analysts say the key factor to watch will be the rate of new holder growth. With only 25,000 wallets left before reaching the burn threshold, faster adoption could accelerate buying momentum and help stabilize BONK’s price.
BONK Price Stalls Inside Symmetrical Pattern
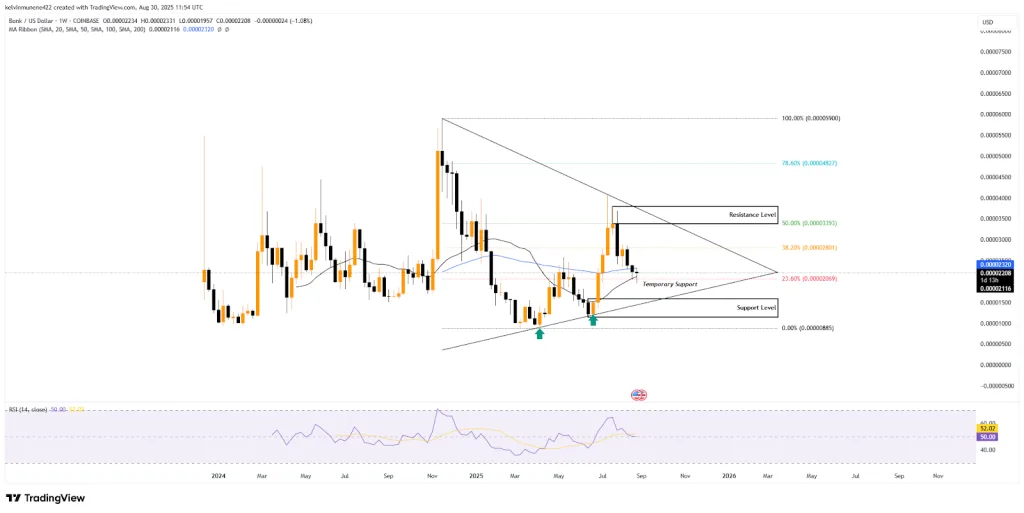
Zooming out, the token has decreased by 46% since its $0.00004070 peak in mid-July. For now, it has short-term support near the 23.60% Fibonacci retracement level, approximately $0.00002069. This level is serving as a temporary foundation as the market evaluates the next possible trend.
The holder supply mechanics might help the token regain momentum again if BONK continues to be adopted in the direction of the one million holders milestone. In this scenario, the cryptocurrency could revisit the $0.000028 level with room to move above $0.000030.

Alternatively, if the 23.60% Fibonacci retracement fails to hold, the token may test lower levels. Analysts point to the $0.000015–$0.000011 range as the next major support zone. This range could provide a buffer against further losses and is likely to attract investors viewing it as a potential entry point, especially for long-term positions.
It is also important to note that BONK has remained within a symmetrical triangle pattern since the beginning of 2025. This formation reflects ongoing consolidation, signaling uncertainty in price movement. The structure implies limited volatility until a decisive breakout occurs, either upward or downward.
Neutral Signals Dominate BONK Price Chart
From a technical standpoint, BONK’s indicators emphasize this consolidation phase. The Moving Average (MA) Ribbon reveals the token trading between its 20-week moving average at $0.00002116 and the 50-week moving average at $0.00002320.
The current price hovering between the MAs demonstrates the absence of intense directional pressure. At present, the longer-term moving average remains above the shorter one, indicating a slight bearish bias.
Supporting this view, the Relative Strength Index (RSI) currently stands at 50. This reflects a neutral market condition, with BONK neither overbought nor oversold. As a result, the token’s immediate trend is likely to remain steady, with no strong momentum signals on either side.
Related: AVAX Builds Momentum With $35 Target in Sight Amid Resistance
Upside Pressure Builds with Clustered Short Exposure
BONK’s OI-weighted funding rate is steady in the green zone, according to Coinglass data. Currently at 0.0032%, this indicates that traders are optimistic about the price of BONK continuing its recent rise. Additionally, a green funding rate suggests that long position holders are willing to pay a premium to short position holders in order to keep their trades open, signaling a strong bullish conviction.

The token also faces a heightened cluster of possible liquidations to the upside. As shown in the BONK’s 30-day Liquidation Map, roughly $3.57 million in short positions are exposed if the meme coin climbs above the $0.00002604 level, compared to about $2.16 million in long positions vulnerable near $0.00001739. This means that a short squeeze could be on the verge of occurring if the price continues to rise, leading to further upward momentum in the token.

Conclusion
BONK remains at a critical juncture, balancing between recovery signals and ongoing consolidation. With a pending token burn, rising adoption, and institutional support, optimism is slowly building. However, technical indicators show neutrality, keeping traders cautious. Key support and resistance levels will shape the token’s next move, while the possibility of a short squeeze adds intrigue.


