BTC Surges to Record $125K Mark, Fueling $500K Price Ambitions

- Bitcoin hit a new all-time high in October, surging to $125,708 and reinforcing bullish momentum.
- Analysts expect growth supported by strong onchain metrics and trading activity.
- Bitcoin’s breakout and sustained momentum reinforce its path toward the $500K target.
Bitcoin has recorded a new all-time high of $125,708, marking a 10.33% rise within its latest two-week candle, according to data shared by CryptoPatel. The analyst stated that this surge confirms Bitcoin’s long-term breakout pattern, one that could lift the asset between $500,000 and $1 million in the coming years. “At this stage, questioning Bitcoin’s long-term potential sounds like doubting the internet back in the early 2000s,” he remarked, describing the movement as part of a precise technical setup.
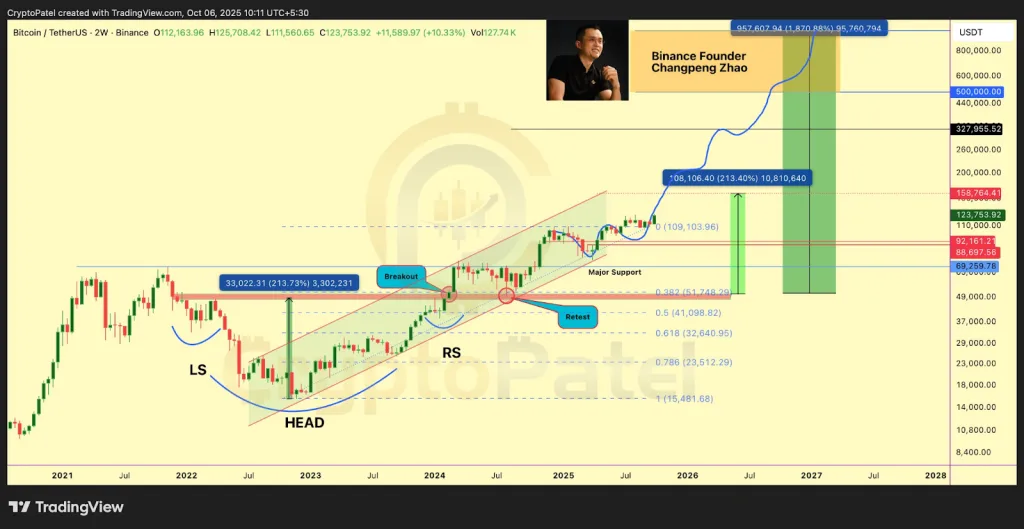
The chart reveals a classic inverse head-and-shoulders pattern, extending across 2021 to 2024. The structure’s left shoulder, head, and right shoulder align precisely, forming the foundation of the ongoing bullish wave. Following a decisive breakout in mid-2024, Bitcoin retested support at around $69,259.78 before resuming its upward movement within a consistent rising channel.
October Returns Reinforce Bullish Seasonality
The Coinglass data indicate that Bitcoin has remained strong in October, its strongest month. In October 2025, the asset experienced an 8.24% upward move, which carried it to its all-time high. The return figures for this month averaged +20.84%, with the median up by +14.71%, showing that “Uptober” is more than just hype for crypto traders.
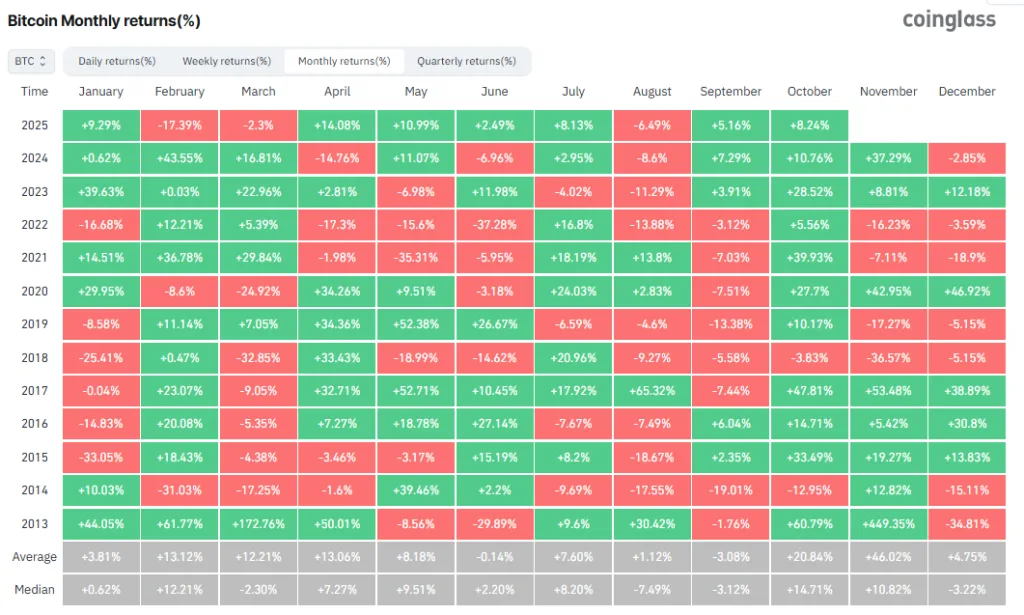
This year’s price move began with January experiencing a 9.29% rise, followed by a 17.39% drop in February, and a decline of less than 2.3% in March. Confidence returned strongly in April, with an outperformance of 14.08%, and in May, with 10.99%. This was followed by a relatively mild 6.49% pullback in August and a modest surge of 5.16% in September. Historically, November tends to yield an average return of +46.02%, often extending the rally begun in October.
Over the last six years, Bitcoin has consistently shown strength in October, recording steady price gains of 10.76% in 2024, 28.52% in 2023, 39.56% in 2021, +27.7% in 2020, +10.17% in 2019, and 47.81% in 2017. This, in turn, supports the 2025 breakout as part of an ongoing performance cycle rather than a one-off event.
Related: Bitcoin’s Uptober Frenzy: Are New Highs Just Days Away?
On-Chain Data Shows Market Strength Despite Cooling Development
Santiment presents a broader view when considering on-chain data about Bitcoin network fundamentals. Bitcoin was trading just under $123,000, supported by a total market cap of $2.45 trillion, which is the highest ever this year, as of October 6, 2025. Concurrently, with an annual inflation rate of 8.6%, this indicates a supply stability following the recent halving cycles.
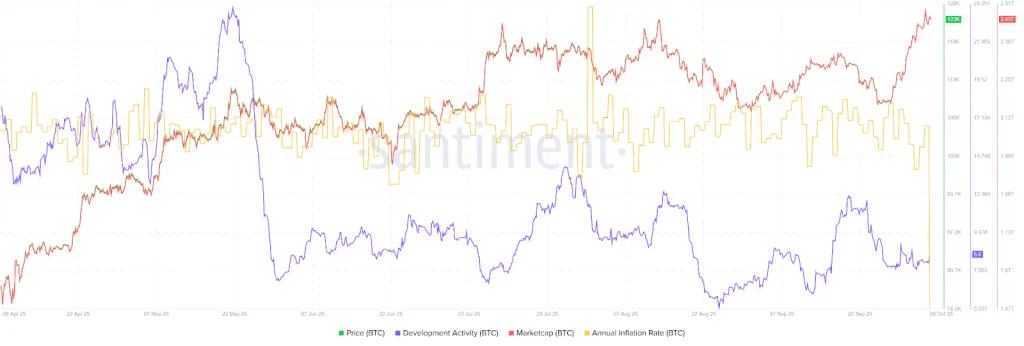
On the downside, development activities have dropped radically from the excess of 24 in May to about 8.6 in October. Even with this continuing decline, Bitcoin prices and market capitalizations continue to go up. Hence, this highlights that investor demand remains the strongest impetus behind the rise.
The meteoric rise of Bitcoin to new highs revived the bullish sentiments among the global market. Technical, historical, and onchain data depict due support and investor interest. Most took this uptrend as a testimony to Bitcoin’s unshakeable and solid grip on modern finance. Yet, speculation can keep changing: could this be the birth of yet another very crafty and record-breaking cycle in the market, or just another breaking cycle?