Bitcoin’s $100K Struggle Highlights Equity Market Ties
- Bitcoin trades slightly above $101,000, showing a firm link with global equity trends.
- On-chain data reveals minimal losses, suggesting a stable mid-cycle correction.
- Analysts argue that liquidity and market rhythm keep Bitcoin in tandem with stocks.
Bitcoin’s fight to stay above the $100,000 mark is raising fresh questions about its growing connection to traditional equity markets. Bloomberg Intelligence strategist Mike McGlone said Bitcoin’s price patterns mirror its earlier cycles, where steep rallies often returned to the 48-month moving average, now near $56,000. He described this pattern as “mean reversion,” a natural cooling after long climbs, adding that “the market gods refresh humility when prices stretch too far.”
Bitcoin’s Correlation With Stocks Deepens
Bloomberg’s chart shows XBTUSD trading at $55,756, near its long-term trend after a rapid rise earlier in 2025. The general belief in riskier assets is reflected in the S&P 500 Index, which has been rising since 2020. Between 2023 and 2025, Bitcoin’s price trend largely followed that of the stock market, hitting the $100,000 mark and then slowly declining to the predicted levels. The 48-month simple moving average has consistently acted as a reset point.
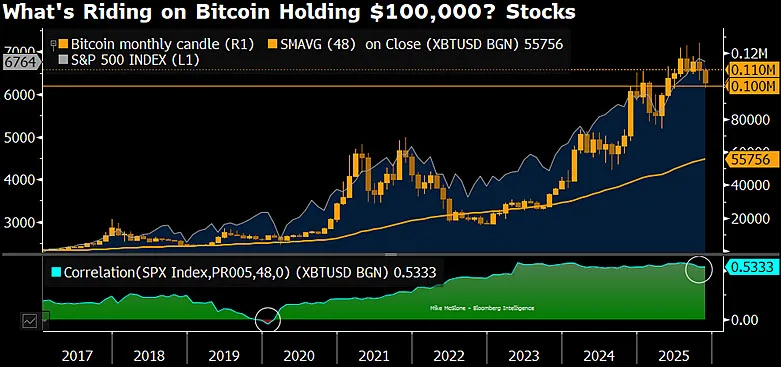
Bitcoin returned to this line in both 2017, 2019, 2020, and 2023 before launching fresh upward cycles. This year’s retreat may signal another natural pause in the same rhythm. Bloomberg data places Bitcoin’s correlation with the S&P 500 at 0.5333, indicating a positive correlation that has strengthened as market liquidity and institutional exposure have increased.
Fresh Market Data Depicts High Volatility: Will the Trajectory Change?
The most recent data from CoinMarketCap indicates that the price of Bitcoin is $101,825.95, a decline of 1.4% over the last 24 hours. Nonetheless, the market is very active, and Bitcoin’s trading volume for the last 24 hours reached $69.98 billion, which is an increase of 18.88%. As a result, Bitcoin’s market capitalization is $2.03 trillion, and its fully diluted valuation is $2.13 trillion.
The intraday chart volatility was around $103,310 and below $101,900, respectively, indicating heavy short-term trading. The volume-to-market-cap ratio is 3.4%, suggesting active flows from retail and institutional traders alike.
Related: Bitcoin Rebounds, Uplifting Major Altcoins—Is the Bull Run Back?
On-Chain Metrics Indicate a Controlled Correction
Data from Glassnode shows Bitcoin’s downturn fits within normal cycle patterns. The firm highlighted the Relative Unrealized Loss, which tracks paper losses relative to market size. The indicator now reads 3.1%, well below the 5% stress line seen during the 2022-2023 bear market.
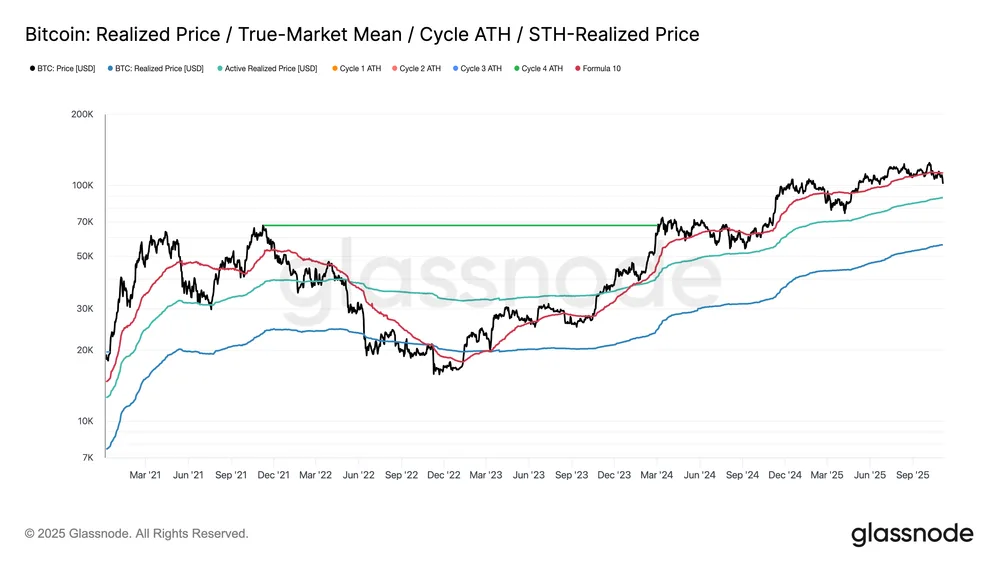
Glassnode’s data also shows that Bitcoin is trading above its realized price (blue line) and active realized price (green line), both climbing steadily as investor cost bases rise. The short-term holder realized price (red line) suggests recent buyers remain in profit. These readings show a steady market rather than panic, similar to mid-cycle corrections in Q3-Q4 2024 and Q2 2025.
Nonetheless, Vineet Budki, the Chief Executive Officer of Sigma Capital, stated that Bitcoin could undergo a substantial price decline of 65 to 70 percent within the next two years. As data continues to evolve and volatility persists across the market, one pressing question remains: Can Bitcoin sustain its $100,000 threshold without initiating another full-cycle correction?