SOL Extends Its Decline Even as Solana Ecosystem Demand Picks Up
- SOL trades lower while the Solana network posts strong DEX volume and high user demand.
- The token sits near the $126 to $121 support zone as selling pressure stays heavy.
- A break above $144 would hint at early strength as network activity continues to rise.
Solana is sliding once again, extending a downtrend that has dominated its chart through the final quarter of the year. The token fell 7.20% in the past 24 hours as the wider crypto market shed 5%, bringing total market valuation to roughly $2.94 trillion.
Besides, fear is spreading across major assets, with sentiment metrics dropping to 20, an “extreme fear” reading that often accompanies rapid selling. Despite SOL’s price struggles, the network beneath it is posting some of the strongest activity numbers anywhere in the sector.
Solana Leads Global DEX Volume and dApp Revenue Through November
November’s data shows that user activity across Solana’s decentralized finance stack continued to climb, even as its native asset weakened. DeFiLlama records place Solana at the top of global DEX volume for the entire month, marking the fifth straight month it has held that position.
From November 1 to November 30, Solana handled $103.078 billion in decentralized exchange trading volume. The nearest competitors fell well behind: BSC processed $81.236 billion, Ethereum $75.785 billion, and Base $36.239 billion. Across all networks, Solana remained the largest contributor to global DEX activity, reflecting heavy user flow and fast settlement speeds.
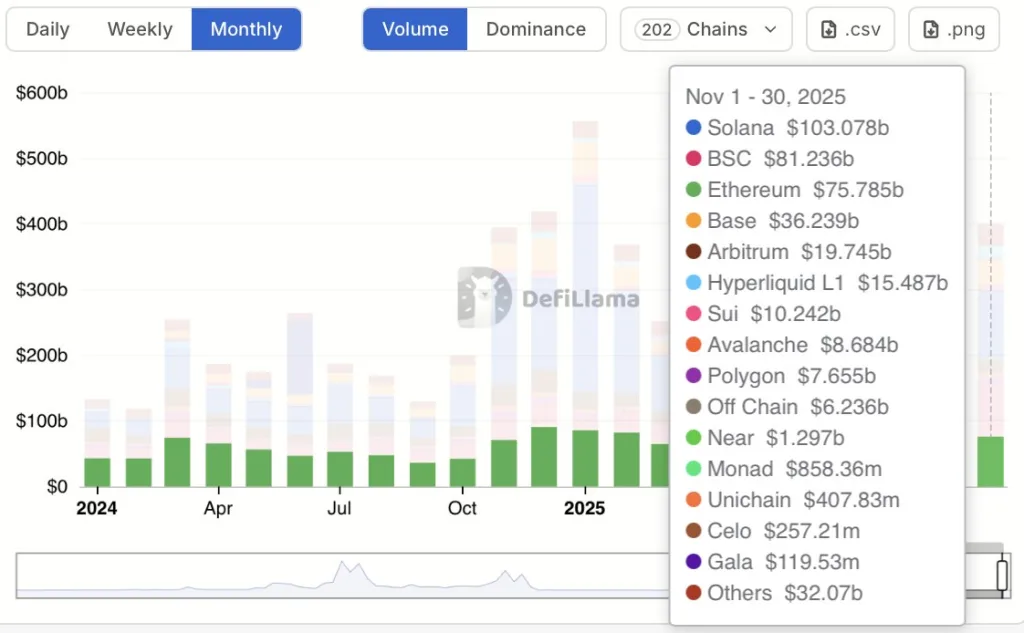
A breakdown of the remaining major chains highlights the gap. Arbitrum recorded $19.745 billion, Hyperliquid L1 reached $15.487 billion, Sui hit $10.242 billion, Avalanche managed $8.684 billion, Polygon reported $7.655 billion, and Near posted $1.297 billion.
Younger chains, such as Monad and Unichain, added smaller amounts but did not shift the overall distribution. Solana maintained a clear lead across both well-established and emerging ecosystems.
Revenue numbers told the same story. Solana generated $3.28 million in 24-hour dApp revenue and $122.65 million over the past 30 days, securing the top spot for the month. Hyperliquid L1 followed with $96.56 million, while Ethereum and Edgex posted $58.87 million and $44.96 million, respectively.
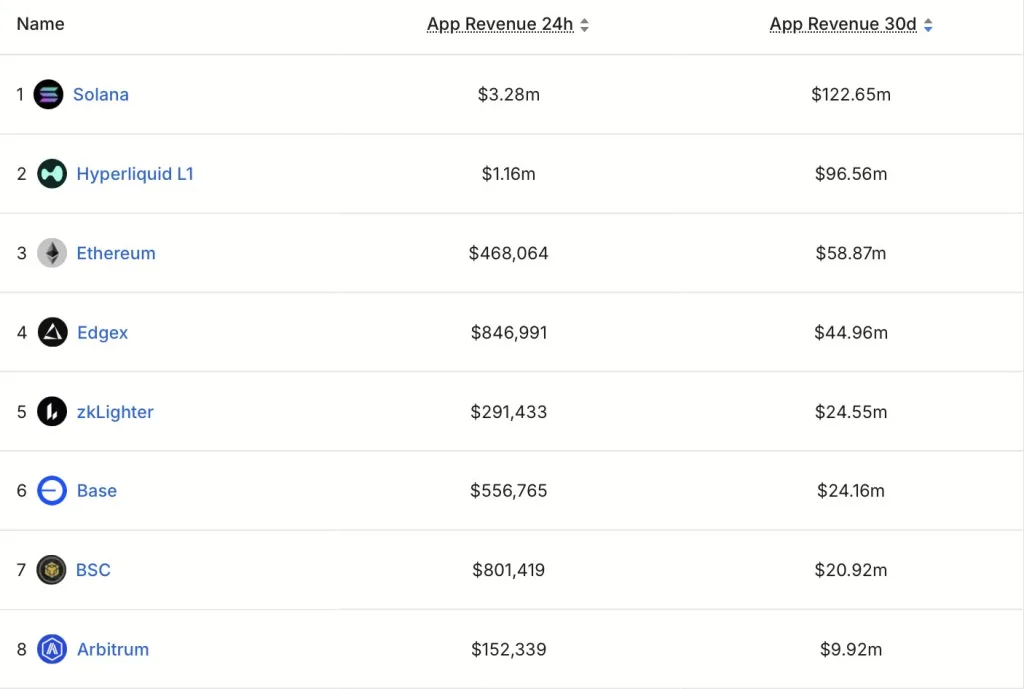
Other contributors included zkLighter at $24.55 million, Base at $24.16 million, BSC at $20.92 million, and Arbitrum at $9.92 million. With both volume and revenue leadership, Solana’s ecosystem remains one of the most active environments for trading, applications, and on-chain commerce.
Bearish Trend Deepens as SOL Tests Long-Term Support Zone
Despite the strength across its ecosystem, SOL’s chart paints a very different picture. Price remains trapped within a descending channel that has shaped trading behavior since mid-September.
Each attempt to break higher has been rejected at the channel’s midline, creating a series of lower highs and lower lows. However, the current move has brought SOL into a dense support region between $126 and $121, aligning with the 2/8 Extreme Oversold Murrey Math levels.
These lines often act as pressure points during extended sell-offs, and their alignment adds weight to this zone. At the same time, the lower boundary of the channel sits beneath $121.47, matching the 0% Fibonacci projection. Moreover, one technical feature does stand out: the RSI divergence.
While price has been forming new lows, the RSI has been lifting slightly, producing higher lows, a signal of a potential bullish reversal in the near term. Besides, with the indicator hovering near 33, SOL now trades deep in oversold territory, leaving limited room for further downside momentum without a period of consolidation or reaction.
Related: SHIB Drops 6% in a Sharp Daily Slide as Bearish Pressure Builds
$144 Remains the Barrier Between Stabilization and Further Losses
The next steps depend heavily on how SOL behaves around the $126–$121 zone. A firm reaction at this level would align with the RSI divergence and suggest the token is attempting to stabilize after a long stretch of selling. Still, support alone is not enough to shift the overall trend.
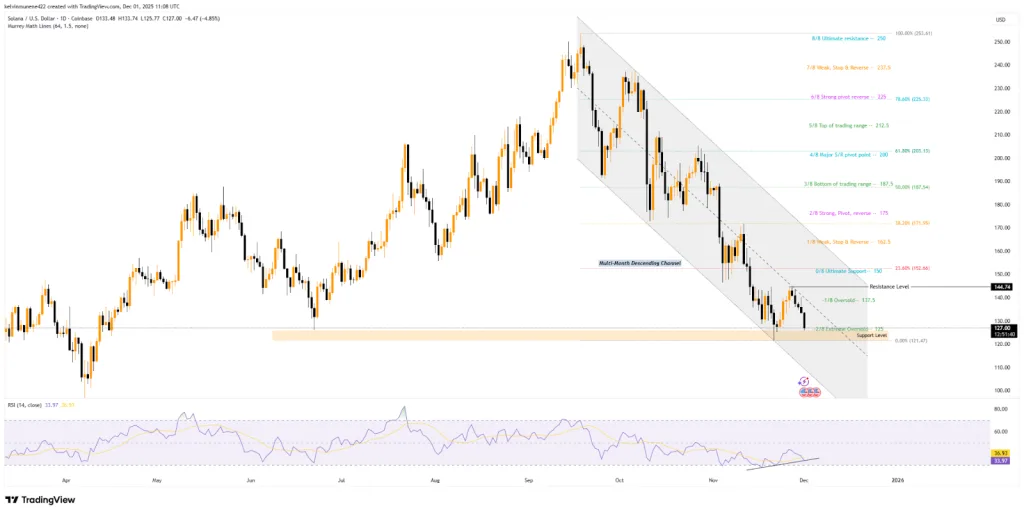
The chart shows that $144 is the level that matters most. It matches the channel’s midline and has repeatedly acted as resistance. Regaining this area would mark the first significant sign of regained strength. Above it, $152 stands out as the next resistance, supported by the 23.60% Fibonacci level and the upper boundary of the descending channel.
Nevertheless, if the support range fails, the chart opens toward the lower half of the channel, with the next major psychological level sitting near $100, a price not revisited since the first quarter of the year.
For now, Solana finds itself in a rare split: a weakening token set against a thriving and expanding ecosystem. The coming trading sessions will show whether network demand eventually translates into price stability or whether the downtrend continues to shape the market’s view of the asset.