BCH Rally Heats Up as Price Climbs 40% YTD Toward Rising Wedge Apex
- Bitcoin Cash gains 40% YTD as price moves toward a major rising wedge resistance zone.
- BCH leads major Layer-1 tokens, as its supply has no unlocks and no VC-linked selling.
- Shorts unwind while open interest grows, creating stronger pressure zones for traders.
Bitcoin Cash is edging into a crucial zone on the weekly chart as its steady rise this year pushes the asset toward the top of a long-running rising wedge. At press time, BCH has gained close to 40% since January. The token hovered around $598 at the start of the week while traders weighed how much room remains before the current structure forces a breakout or a pause.
Price Advances Toward Multi-Year Wedge Resistance
Market data from TradingView shows BCH approaching a resistance area between $622 and $651. That band has sent the BCH price lower twice since late 2024, and it aligns almost perfectly with the wedge’s upper edge. Because price and support have tightened into a narrow zone, the market is nearing a point at which the trend cannot continue without a clear decision.
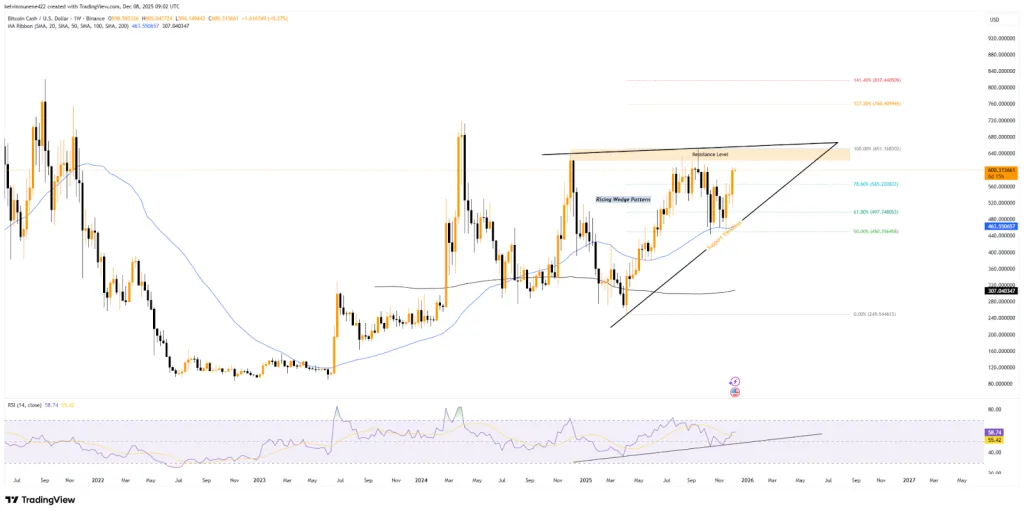
A move above this region would open the way to Fibonacci extension levels near $760 and $817. These marks are commonly monitored, but they remain technical checkpoints rather than predictions. However, if BCH fails to break through, the wedge may stretch deeper into next year, as it has already guided nearly twelve months of movement.
Momentum Builds as RSI Trendline Holds
The weekly RSI sits around 58 and continues to track an upward trendline that has remained intact for several months. Analysts who watch longer-term behavior note that the current reading does not suggest exhaustion.
BCH also trades above its 50- and 200-week moving averages, a structure that typically appears when a trend has some durability. The 200-week average near $307 still acts as a deep support level and has yet to be challenged during this rally.
BCH Outperforms Major Layer-1 Networks in 2025
Comparative data shared by independent researcher Crypto Koryo shows BCH far ahead of the rest of the Layer-1 blockchains. Tokens such as BNB, Tron, and Hyperliquid’s HYPE token posted only slight advances this year.
Many well-known chains—including Ethereum, Solana, Avalanche, Cardano, and Polkadot—remain sharply lower, with several down more than half since January. Koryo pointed to BCH’s unusual supply structure as one possible reason for its resilience.
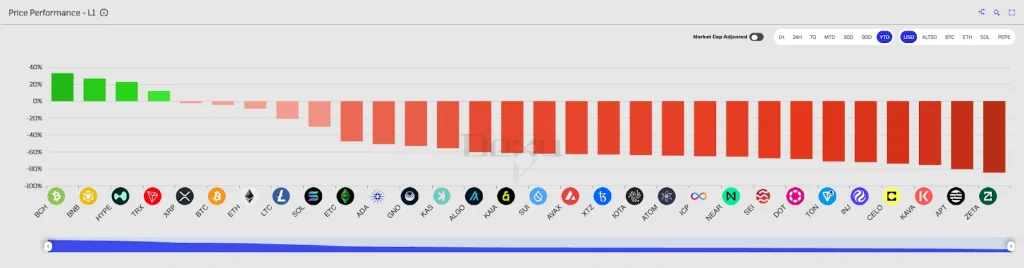
The network has no foundation treasury, no venture-capital allocations, and no scheduled unlocks, removing an entire category of sell-side pressure. “The entire supply is circulating. No unlocks. No foundation. No VCs dumping,” the analyst wrote.
Related: XRP Faces Deepest FUD Since October as Price Declines
Rising Open Interest and Short Liquidations Fuel Momentum
Not to leave out, derivatives markets have been active as the rally progressed. Open interest climbed steadily from mid-November and now sits near $733 million. Besides, over the past day, roughly $1.4 million in short positions were liquidated, compared with around $500,000 in long liquidations.
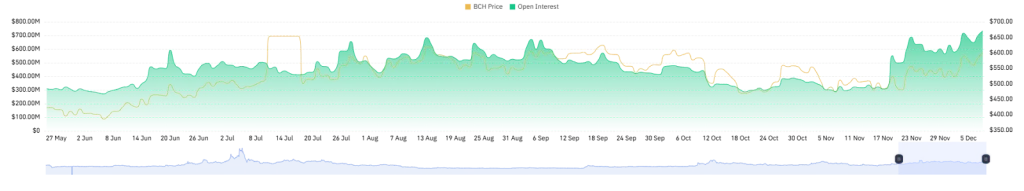
That imbalance suggests sellers were caught leaning the wrong way and were forced to exit as the price moved against them. Rising open interest often signals stronger swings ahead. With BCH approaching the narrowing point of its wedge, traders are preparing for a shift in volatility, even if the direction remains uncertain.