
According to crypto analyst Ali Martinez, Bitcoin investors should closely watch the cryptocurrency’s current market behavior, following trends observed in previous halving events. Ali highlights that, historically, Bitcoin has undergone significant consolidation periods after halvings before resuming its upward trajectory. In 2016, this consolidation lasted for 189 days, while in 2020, it was shorter, at 87 days.
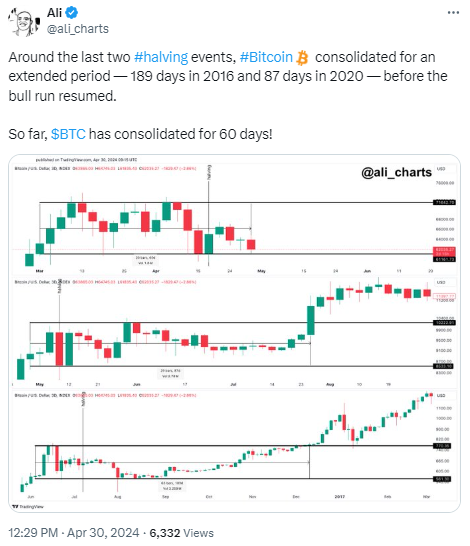
Currently, Bitcoin has been consolidating for 60 days. Thus, Ali speculates that it might follow the patterns seen in past cycles. Understanding these trends is crucial for those looking to make informed investment decisions. Additionally, the historical data provided by market experts like Ali helps paint a clearer picture of what might be expected in Bitcoin’s price movement.
In addition, crypto analyst Rekt Capital has highlighted a significant pattern in Bitcoin’s trading behavior related to its halving events. He terms the periods just before and after halving the “Danger Zones” due to their historical tendencies for price retracements. Specifically, Bitcoin commenced its pre-halving downturn 30 days before the halving, reflecting similar movements from the 2016 cycle.

Moreover, this pattern persists into the post-halving period. In 2016, Bitcoin experienced an 11% drop three weeks after the halving. The current cycle suggests that cryptocurrency might follow a similar path. Today, 11 days post-halving, Bitcoin stands at the brink of the so-called purple “Danger Zone.”
Additionally, based on historical data, the next ten days could prove critical for Bitcoin’s price direction. The $60,600 level represents a significant support area where further declines might occur, echoing past post-halving price behaviors. Understanding these historical patterns provides a strategic advantage. They seek to gauge whether Bitcoin will repeat the volatile trends observed in previous cycles.
As of press time, Bitcoin is trading on a downtrend. The leading asset declined to $61,220, recording a decrease of 1.80% in the past 24 hours. Bearish activity has been holding tight on the Bitcoin market, as it records a decline of 7% and 13% on the daily and monthly charts, respectively. The market has reduced to $1.20 trillion while the trading volume displays a significant increase of 45%, rising to $30 billion.