
Cryptocurrency prices harness modest gains on Monday amid a trading holiday in the U.S. market.
- Bitcoin price retraced with modest gains after initial gains on Monday.
- Bears challenge the critical 21-day moving average on the daily chart.
- A bearish momentum oscillator gives potential reversal from the current level.
Bitcoin price (BTC) started the new trading week on a higher note but could not defend the gains. The price trades in a sideways movement below $16,900. Trading holidays in the major market kept the gains limited in the most prominent cryptocurrency.
As of writing, BTC/USD is exchanging hands at $16,800, up 0.2% for the day. The 24-hour trading volume jumped to $12,694,809,534 as per CoinMarketCap.
Bitcoin price trades near the critical resistance zone
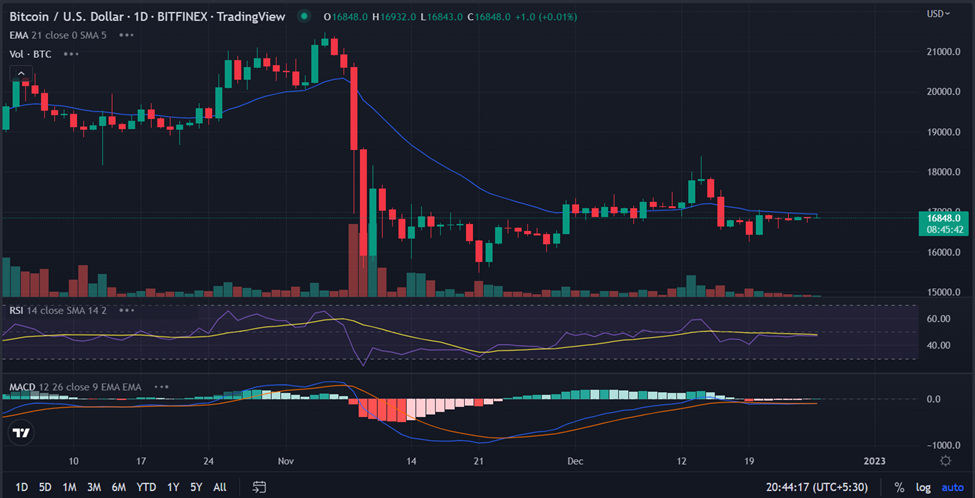
On the daily chart, the Bitcoin price formed multiple Doji formations near $16,800. The price retreated after testing the high of $16,914.42. The formation of the ‘Hammer’ candlestick in the previous trading session resulted in the recent price action.
Currently, the bulls attempts a recovery toward $17,000 amid the formation of the bullish candlestick pattern. Traders continue to face challenges near the $16,920 level for the past few sessions. If the BTC price closes above the mentioned level on the daily time frame, then there is a higher chance it could retest $17,200.
Further, sustained buying pressure could see more gains toward $17,690.
On the other hand, a shift in the bearish sentiment, and if the price stays below $16,800 for a longer period then bears would have more chances to take over the trade.
On moving lower, the Bitcoin price could test the $16,600 level. Next market participant could test the low of December 19 around $16,300.
Technical indicators:
RSI: The daily RSI reads at 47 with a neutral bias. Any downtick in the oscillator would support the downside momentum in the price.
MACD: The indicator oscillates near the central line with a bearish crossover, signaling the presence of sellers.
Conclusion: Bitcoin price trades in a predefined range of $16,900 and $16,600 in the short term. A breakdown of the range would dictate the next directional setup.