
Bitcoin stands at the cusp of a bullish uptick as the Daily Relative Strength Index (RSI) has maneuvered its way out of a descending wedge formation. This technical indicator is traditionally seen as a harbinger of upward momentum. Crypto Faibik, a seasoned analyst, casts a spotlight on this development, suggesting a 15-20% surge in Bitcoin’s value is on the horizon.
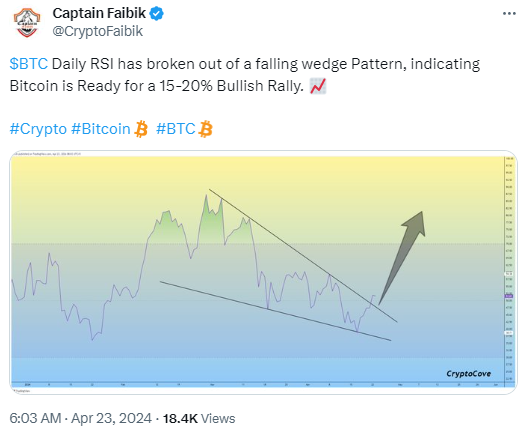
The trendline, once a constraint, now gives way to optimism among investors. Additionally, such breakouts are key moments that traders should often monitor for signs of a market turnaround. This forecasted rally offers a reprieve from recent market turbulence, potentially bolstering confidence in Bitcoin’s resilience. Consequently, the wider crypto community may see this as a signal to realign their strategies.
Looking at the broad market performance, the bullish sentiment is losing ground as the bears strike back. As per CoinMarketCap data, the global crypto market cap is at $2.44 trillion, showing a mere increase of $0.13%, while the trading volume shows a surge of 5% with a value of $66.77 billion. Bitcoin’s dominance is at 53.6%, with the fear and greed index at 65, indicating a greed sentiment.
As of press time, Bitcoin is exchanging hands at $66,409, recording a mere increase of 0.09% on the daily time frame chart. Over the past week, BTC has gained 5%, while the monthly chart displays an increase of 3%. The market capitalization is hovering at the $1.30 trillion mark while the trading volume is standing at $24 billion.
Technical indicators on the daily chart present a bullish picture. Most of the indicators are heading toward positive territory as the bullish trend reverses. The Relative Strength Index (RSI) has climbed from the oversold region and is currently at the neutral level. An increase in buying pressure could send the RSI toward the overbought region, which could drive the prices higher again.
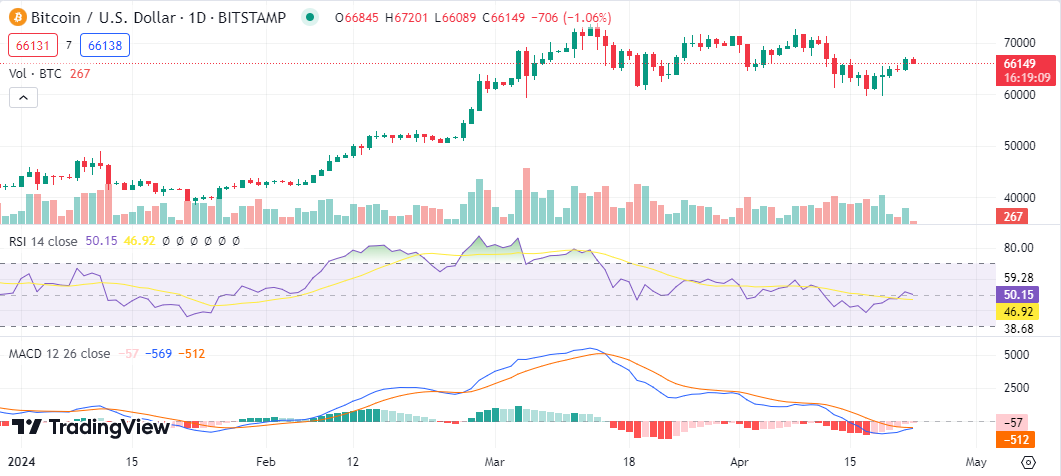
Moreover, the Chaikin Money Flow (CMF) indicator is currently above the zero line in the positive region with a value of 0.16. Finally, the Moving Average Convergence Divergence (MACD) suggests an imminent bullish crossover as the MACD line is inching the signal line to cross above it.