
Bitcoin Archive, a prominent voice in the crypto community, recently highlighted Bitcoin’s impressive momentum, observing a 77% increase in its value, which escalated from $41,000 to an all-time high of $73,757. According to the analysis, Bitcoin is on the verge of forming a new rally, which could send the price to new highs.
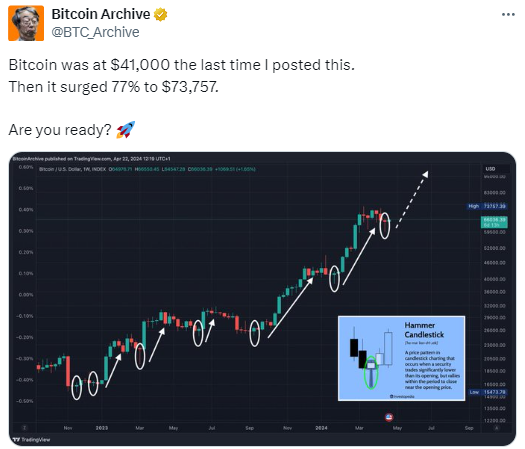
The chart is marked with several instances of a price pattern known as the “Hammer Candlestick,” which indicates a robust market sentiment. These patterns are traditionally considered indicative of potential reversals in downtrends, as they suggest that despite selling pressure during the trading period, strong buying interest drives the prices back up near the open.
Each of the highlighted hammer patterns is followed by a continued upward trend, suggesting that buyers are repeatedly entering the market with force after each dip. This persistence is a strong signal to market watchers that investor confidence in Bitcoin is steadfast, and the uptrend may have the stamina to continue.
As of press time, Bitcoin is exchanging hands at $66,470, recording an increase of 2.27% in the past 24 hours. Despite trading below the $65k region in the early hours of today’s session, the bulls have been persistent, pushing the price high to challenge resistance at the $66,500 level. The trading volume has seen an impressive surge of 15%, with a value of $25 billion, while the market capitalization stands at $1.29 trillion.
Bitcoin’s 4-hour chart reveals a robust uptrend characterized by consecutive higher highs and higher lows, indicating growing strength. The Chaikin Money Flow (CMF) indicator hovers around 0.16, indicating a moderate influx of capital into Bitcoin, reinforcing positive market sentiment.
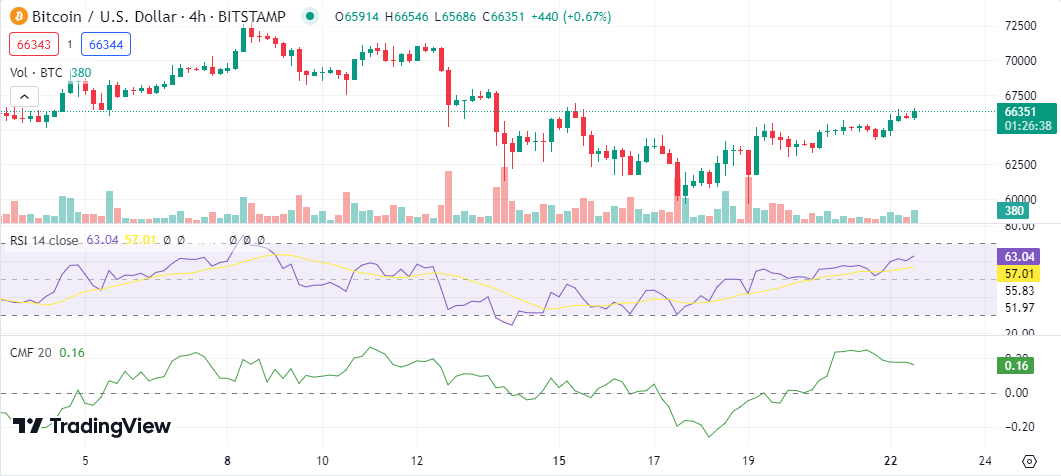
The Relative Strength Index (RSI) remains above the midpoint but below the overbought threshold, suggesting potential for further upside without immediate overextension concerns. Of particular interest is the 20-day Exponential Moving Average at 65,892, which Bitcoin has consistently maintained above. This positioning signals a bullish sentiment, potentially heralding additional gains if the trend persists.