
Bitcoin is currently the center of attention in the crypto market, as both traders and enthusiasts keenly watch its value changes. In the latest developments, the cryptocurrency has shown a remarkable pattern on the hourly timeframe chart.
It was previously caught in a downward spiral characterized by decreasing peaks and troughs. This trend is often seen as a negative indicator, reflecting a pessimistic outlook among investors. Nevertheless, the landscape shifted dramatically with a sudden uptick in Bitcoin’s value.
This abrupt rise in price led to a breach of the descending channel’s upper limit, hinting at a possible shift in market dynamics. Crypto analyst Captain Faibik has been closely monitoring these movements, suggesting that this bullish sign could propel Bitcoin to an ambitious price of $74,000.
Bitcoin has seen a significant rally, with its price soaring to $67,276, marking an 8.07% increase over the past 24-hours. The 24-hour trading volume has also spiked, with an increase of 16.68%, totaling $59.67 billion, which indicates a heightened level of activity among market participants. The current CoinMarketCap ranking is 1, with a market cap of $1,317,359,384,053.
The ability of Bitcoin to maintain its position above the channel is crucial. It could signal to investors that the tide is turning, potentially ushering in a new wave of buying activity aimed at reaching the $74,000 mark. Conversely, failing to sustain this upward trajectory might see Bitcoin slip back into its previous pattern, reigniting bearish sentiments.
This analysis reflects a significant turning point for Bitcoin, as it challenges the prevailing bearish sentiment. The crypto community is abuzz with speculation, eagerly awaiting to see if Bitcoin can meet the lofty expectations set by analysts like Captain Faibik. As always, the market remains unpredictable, with every rise and fall closely scrutinized for signs of what the future might hold.
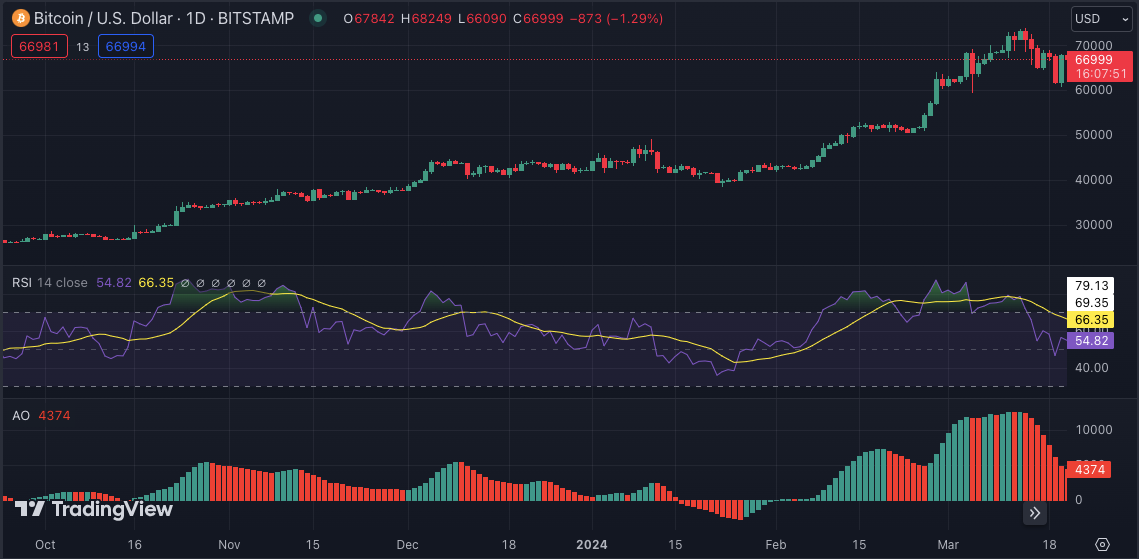
The technical indicators for Bitcoin showcase a dynamic scenario in the cryptocurrency markets. The Relative Strength Index (RSI) remains moderately above the midline at 54.82, suggesting a neutral market sentiment with a slight tilt towards bullishness. Moreover, the Awesome Oscillator (AO), which measures market momentum, is displaying a decrease in its histogram, reflecting a short-term bearish cycle within a broader bullish trend.


