BNB Price Falls 10% as Liquidations Surge and Market Confidence Dips

- BNB sinks to $812 after a 10% daily slide and a 25% decline across the past month.
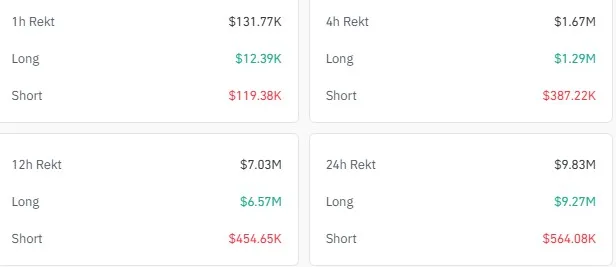
- Long liquidations top $9.4M as BNB volume climbs beyond $4.5B during the sell-off.
- Open interest drops from $2.97B to $1.41B while daily exchange outflows exceed $65M.
BNB spent the week under severe pressure as a fresh wave of sell-offs swept across the crypto market. The token slid to $812, extending a 10% drop in just a day and deepening a 25% decline over the past month, according to CoinMarketCap.
The broader downturn has been unforgiving, and BNB was no exception as traders reacted to a crowded field of liquidations and fading short-term confidence. Even with the slide, activity around the token has not slowed.
In fact, it has moved in the opposite direction. BNB’s daily trading volume climbed past $4.5 billion, a rise of more than 50%, showing that traders are still engaging aggressively. Heavy volume in a falling market usually signals turbulence, not abandonment, and this latest surge reinforces that view.
Long Liquidations Dominate as Bulls Get Forced Out
Derivatives data paints the clearest picture of what happened beneath the surface. More than $9.27 million in long positions were liquidated within 24 hours, while shorts accounted for just $564k. The imbalance speaks for itself.
Many traders had positioned for a bounce, only to be pushed out as the sell-off steepened. The weekly candle reflects this same pressure, slicing below several short-term support zones and turning what began as controlled weakness into a full retreat.
Technical Structure Weakens as Price Breaks Beneath Fib Support
Per the weekly chart analysis, BNB reached its recent peak near the 100% Fibonacci level at $1,375, but momentum quickly faded. The token then slid toward the 38.20% Fib at $839, a level that helped guide price structure in earlier weeks. That line has now been broken, forcing the market to examine what sits beneath it.
The next clear region lies between $724 and $663, an area where the price previously flipped from resistance to support. It acted as an accumulation block during earlier cycles, and chart history suggests that traders pay close attention when the market approaches it.
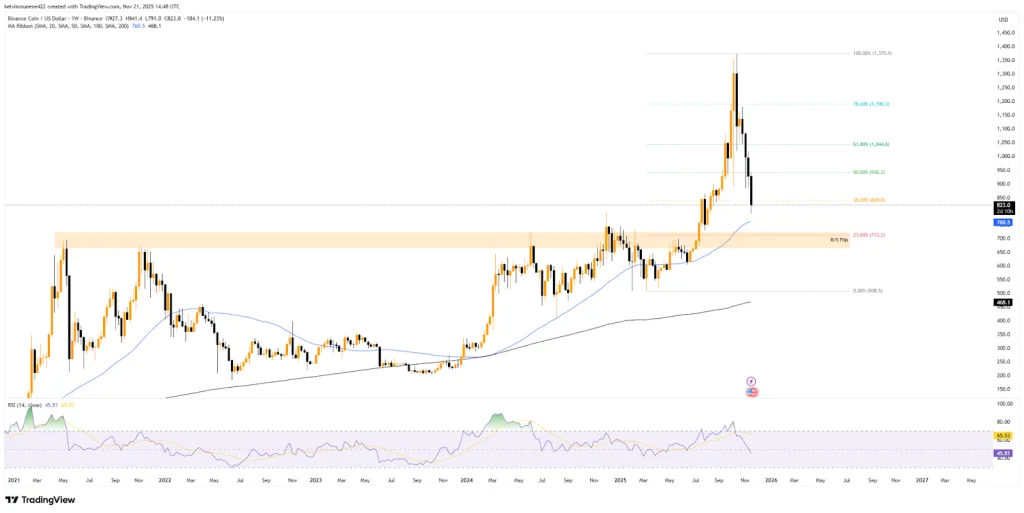
Momentum indicators don’t offer much relief. With the RSI near 45 and still drifting lower, traders see continued room for weakness. Nevertheless, the longer-term moving averages remain constructive.
Both the 50-week and 100-week MAs continue climbing and sit not far below the current price. These averages have steadied BNB during past downturns, and they remain important as the token searches for a floor.
However, BNB would need to reclaim $839 and hold it to signal any kind of recovery. Only after doing that can higher checkpoints, such as the 50% Fib at $942 and the 61.80% Fib at $1,044, come back into play.
Leverage Unwinds as Open Interest Drops to $1.41B
A sharp pullback in open interest adds another layer to the story. The figure has fallen from $2.97 billion on October 8 to $1.41 billion, showing that traders are retreating from leveraged positions rather than building new ones.
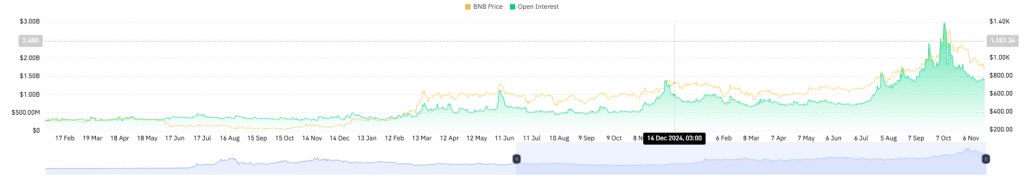
This type of decline often signals exhaustion and can eventually pave the way for calmer market conditions once forced selling subsides. On the other hand, spot market flows tell a different story altogether. Since November 10, BNB has consistently recorded net outflows from exchanges.
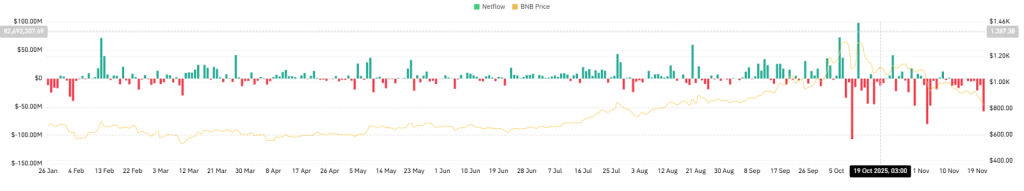
Today’s outflow exceeded $65 million, the largest during that period. Moving tokens off exchanges generally indicates long-term storage, suggesting some holders may be preparing to sit through the volatility instead of trading it.
Related: SEI Slides to 7-Month Support as Analysts See a 400% Jump to $0.70
Analyst Flags Three Support Zones Based on On-Chain Clusters
On-chain researcher Ali_charts pointed to three major support zones built from realized price distribution data:
- $853
- $660
- $564
The first level at $853 has already been breached, making the deeper areas at $660 and $564 more important.
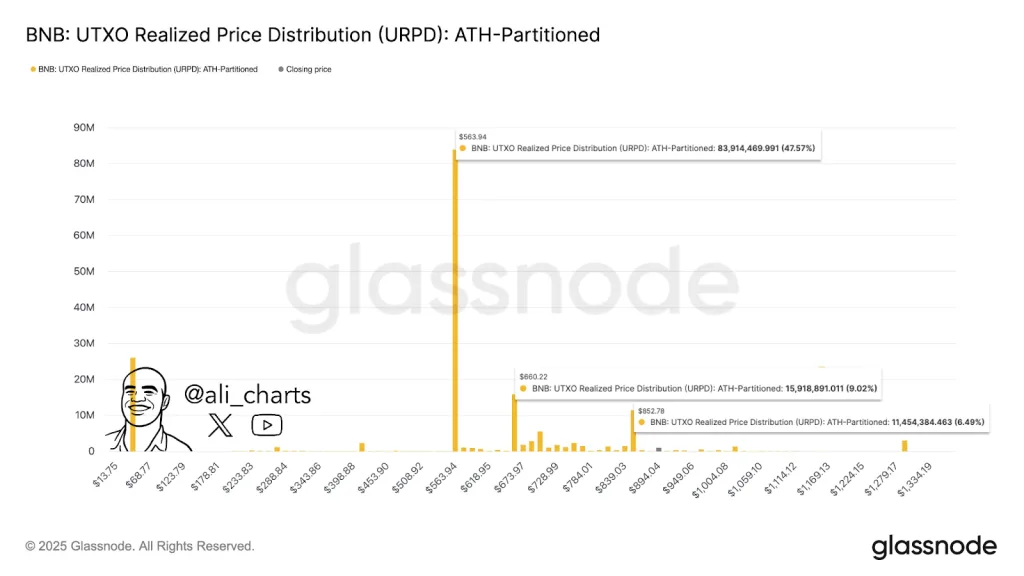
These zones represent some of the largest historical clusters of buying activity, meaning that many tokens last changed hands there. Such regions tend to play a key role when markets correct sharply, as they often attract defensive buying.
In summary, BNB continues to face strong downside pressure as liquidations rise and confidence weakens. With open interest falling and support levels nearing, the market now waits to see if buyers defend key zones or allow deeper retracement.