
TRX is currently trading at $0.077762, up 0.42% in the last 24 hours. It has a market capitalization of $6,989,743,224, ranking 11th among all cryptocurrencies. The coin has a circulating supply of 89,885,964,519 TRX and a maximum supply of 100,850,743,812 TRX.
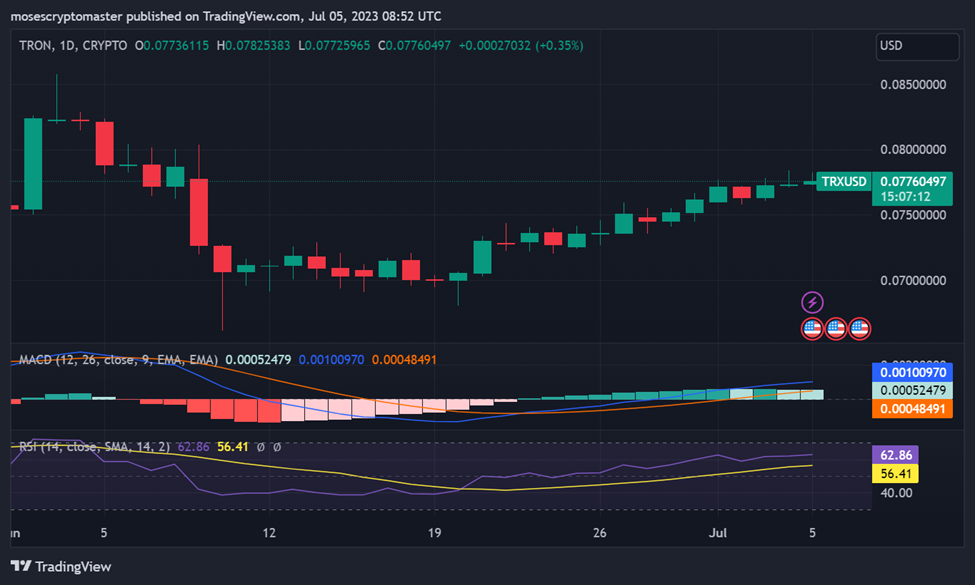
The coin has been facing resistance from the 50-day moving average (MA), currently at $0.0853. The 50-day MA has also crossed below the 200-day MA, forming a bearish death cross.
If Tron could break above the 50-day MA and the resistance level of $0.09, it could target the next resistance levels of $0.11 and $0.13, which are the 61.8% and 50% Fibonacci retracement levels, respectively. On the other hand, if Tron fails to hold above the support level of $0.067, it could slide further to the next support levels of $0.06 and $0.05, which are the psychological and historical lows, respectively.
The coin has formed a bullish divergence with the relative strength index (RSI), a momentum indicator measuring the strength of price movements. The RSI is 52.41, indicating that the coin is neither overbought nor oversold. A bullish divergence occurs when the price makes lower lows while the RSI makes higher lows, suggesting that the selling pressure is weakening and the buyers are gaining strength.
Polygon is currently trading at $0.701440, down 0.92% in the last 24 hours. It has a market capitalization of $6,537,047,356, ranking 12th among all cryptocurrencies. The coin has a circulating supply of 9,319,469,069 MATIC and a maximum supply of 10,000,000,000 MATIC.
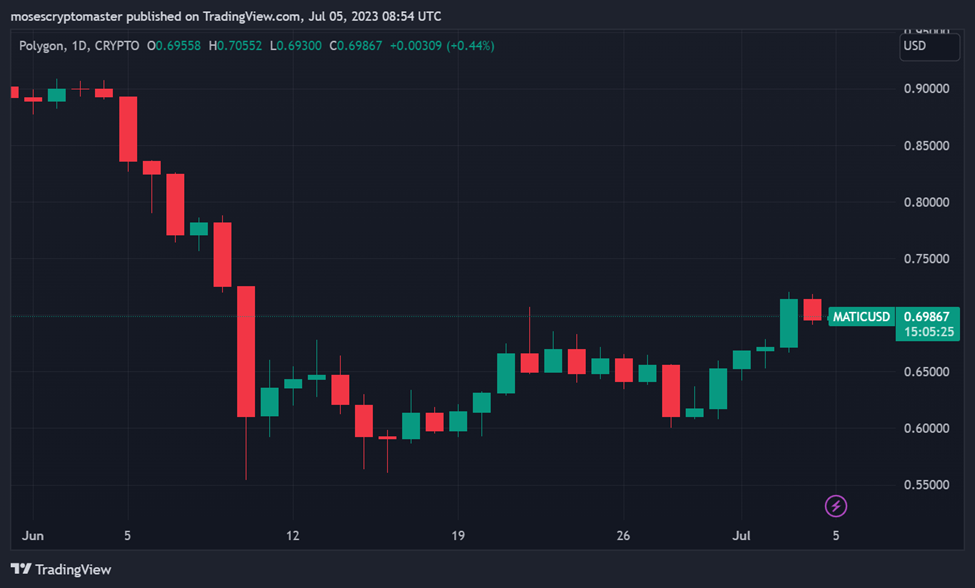
MATIC is currently trading near the channel’s upper boundary, which is also near the resistance level of $0.72. The coin is also above the 50-day MA and the 200-day MA, rising and acting as dynamic support levels. The RSI is currently at 57.8, indicating that the coin is still in bullish territory but not overbought yet. The RSI has also formed a bullish divergence with the price, similar to TRON.
If Polygon could break above the resistance level of $0.72 and stay within the channel, it could target the next resistance levels of $0.8 and $0.9, which are round numbers and psychological barriers. On the other hand, if Polygon falls below the lower boundary of the channel and the support level of $0.64, it could drop further to the next support levels of $0.56 and $0.48, which are 50% and 61.8% Fibonacci retracement levels respectively.
In conclusion, Tron (TRX) and Polygon (MATIC) have shown bullish divergences in their market trends. For TRX, breaking above the resistance level of $0.09 could lead to significant gains, while for MATIC, surpassing the $0.72 resistance could open up new opportunities. Nevertheless, investors should remain aware of potential declines if these cryptocurrencies fail to hold their current support levels.