Cardano Drops to Key Lows as ADA Tests Multi-Year Support

- ADA falls into the $0.40–$0.27 zone after losing more than 60% of its value since August.
- Exchange outflows exceed $14M as more ADA leaves trading platforms for private storage.
- RSI near 33 signals heavy selling pressure as ADA presses against long-term support.
Cardano (ADA) has slipped to its weakest levels in over a year, intensifying concerns that the token could soon fall out of the top 10 crypto assets by market capitalization. The drop comes after months of persistent selling pressure that has pushed ADA toward a multi-year support zone between $0.40 and $0.27, a region last tested during the second half of 2024.
The decline underscores a prolonged bearish trend that has been in place since ADA peaked near $1.00 in mid-August. Since then, it has shed more than 60% of its value, triggered technical breakdowns, and tested historically significant levels that now determine whether Cardano forms a bottom or sinks deeper.
Downtrend Pressures Key Technical Zones
The weekly chart illustrates the extent of the strain on ADA. At press time, the token trades beneath both the 50-week and 200-week moving averages, turning them into overhead resistance. Besides, a decisive break of the $0.55–$0.51 support zone, which had protected ADA throughout 2025, marked a significant turning point.
Once that level gave way, price flowed directly toward the lower multi-year range. That decline has placed the asset inside the $0.40–$0.27 support area, one of the few standing zones that have historically attracted long-term accumulation.
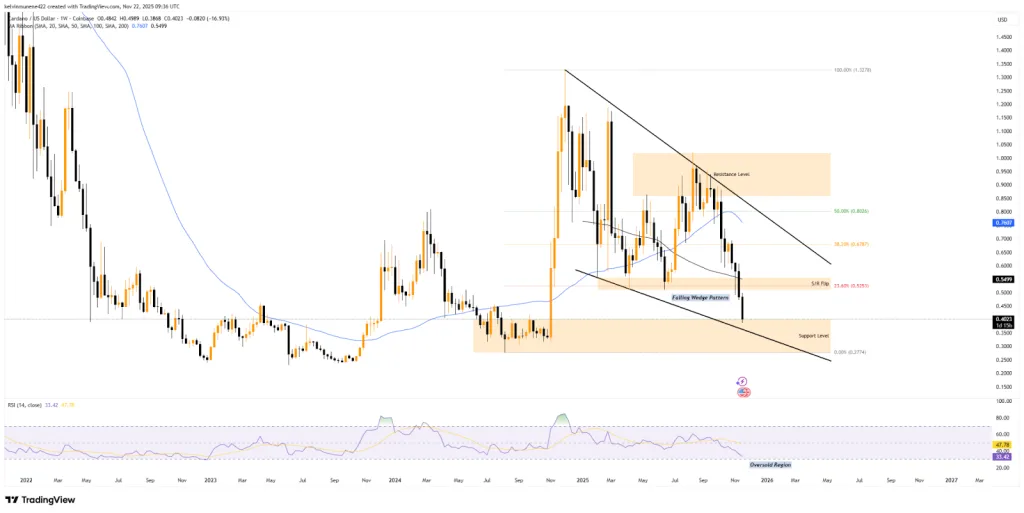
On the same note, the structure of the chart reveals a falling wedge, a pattern that often appears late in bearish cycles as selling momentum slows, hinting at possible trend reversals.
Momentum readings also reflect similar exhaustion. The weekly RSI near 33 places ADA firmly within oversold territory, a level it rarely holds for long without some form of stabilization or recovery attempt.
Exchange Flows Highlight Accumulation Behavior
Not to leave out, on-chain data adds an important layer to the picture. Analysis of ADA’s exchange netflow shows consistent outflows across much of the year, with red bars dominating the chart.
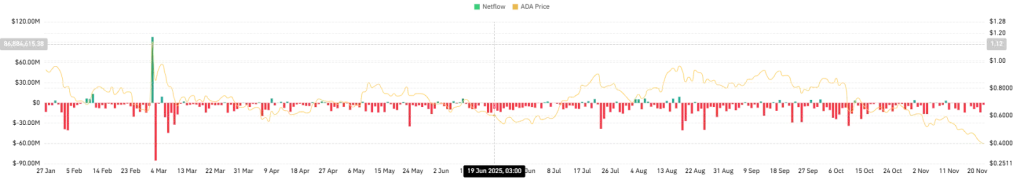
This pattern intensified during the current decline. Over the most recent trading sessions alone, more than $14 million worth of ADA moved from exchanges to private wallets. These flows point to two clear behaviors:
- Reduced short-term trading supply as fewer tokens remain available on exchanges.
- Long-term positioning, as holders move assets away from selling venues and into storage.
Such activity has previously aligned with periods where price was searching for a cyclical floor, especially during heavy drawdowns.
Key Price Levels That Now Determine the Trend
With all these factors in place, and the ADA token sitting on one of its strongest historical support regions, the token appears poised for a potential bottom. However, any meaningful uptrend will likely depend on how the price behaves at these specific levels:
- $0.40–$0.27 Support Region: This is the deepest and most established floor on the chart. Holding above it is essential to prevent a slide toward the $0.27 Fibonacci low.
- $0.55–$0.51 Mid-Range Barrier: This level, previously a multi-month support zone, now aligns with the 23.6% Fibonacci retracement at $0.5253. Reclaiming it would be the first meaningful sign of recovery.
- Higher Fibonacci Ranges: A successful break above the mid-range support could open the door toward $0.67 (38.2% Fib) and $0.80 (50% Fib). These levels form the next structural checkpoints for any sustained upward move.
For now, the market is watching whether ADA can stabilize above its multi-year base and convert the wedge structure into a broader trend reversal.
Related: BNB Price Falls 10% as Liquidations Surge and Market Confidence Dips
Conclusion
Cardano’s price decline has carried it back to one of its most critical long-term ranges, placing the asset at a decisive moment. The exchange flow data shows steady accumulation despite the falling price, while technical indicators point to a market approaching exhaustion. Defending the $0.40–$0.27 zone remains the central test, and only a return above $0.55 would confirm the first steps of a broader recovery.