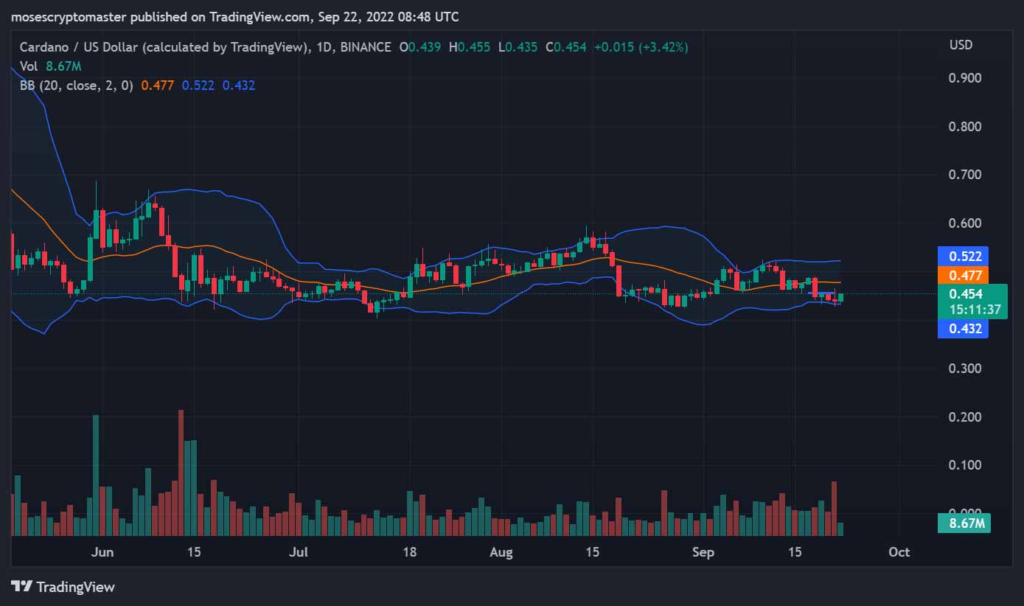
Cardano price analysis shows that the virtual currency has a bullish trend and that resistance is present at $0.521 while support is found at $0.423. The 50-day moving average (MA) slows horizontally, indicating a possible consolidation phase, while the 200-day MA is still rising, which means that the long-term trend is still bullish.
The MACD shows a bearish crossover with the signal line as the histogram size has decreased. This suggests that selling pressure could increase, and ADA prices could reverse lower soon.
On the hourly chart, it can be seen that ADA prices have formed a bullish flag pattern which is a continuation pattern, which could mean that prices could move higher in the near term.
Cardano price analysis suggests that ADA prices could retrace lower in the near term, but the long-term trend is still bullish.
Cardano price movement in the last 24 hours: ADA trades sideways as bullish winds blow
ADA prices have been on a roller coaster ride in the last 24 hours as the virtual currency first surged to $0.464 and then quickly pulled back to $0.443.
The 24-hour trading volume for the currency is $1 billion, and ADA is currently the 8th largest cryptocurrency with a market capitalization of $15 billion. The overall market sentiment seems bullish on ADA, with most major indicators pointing to further upside potential.
On the daily chart, the price trades between $0.52 and $0.40, as both sides fail to take charge. The market awaits a clear direction as the bulls attempt to break above the $0.52 resistance while the bears try to push prices below the $0.40 support.
ADA/USD 4-hour price chart: ADA forms a Symmetrical triangle pattern
The 4-hour chart shows a symmetrical triangle pattern which is a neutral pattern. The convergence of the upper trendline forms the triangle pattern at $0.464 and the lower trendline at $0.443.
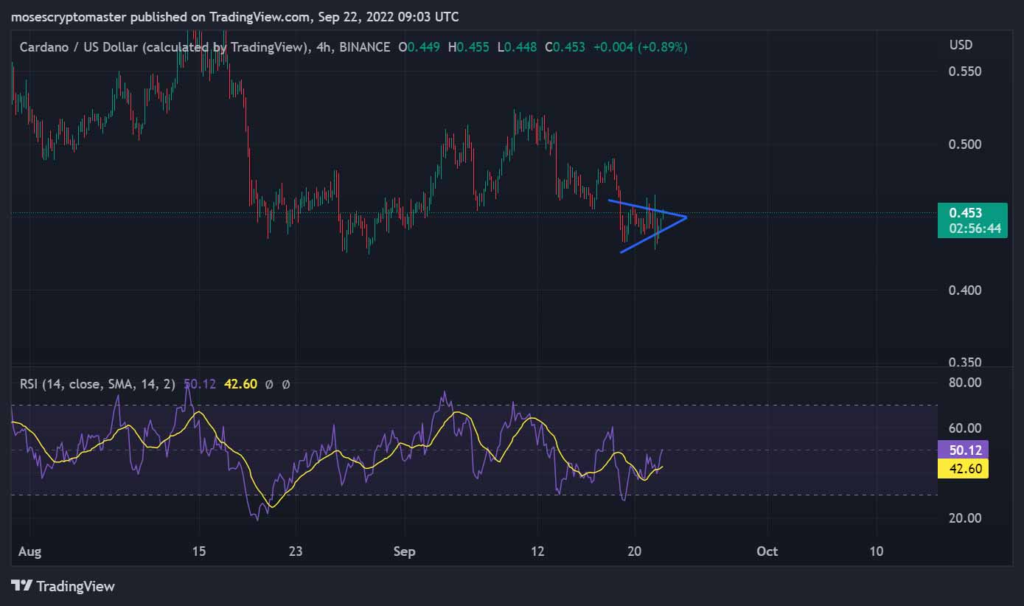
A breakout from this pattern could occur in either direction, but given the current market conditions, it is more likely that ADA prices will break to the downside.
If ADA price break below the lower trendline of the triangle pattern, it might fall to $0.423, the next support level. On the other hand, if the ADA price breaks above the upper trendline of the triangle pattern, it could rise to $0.521, which is the next resistance level.
The Chaikin money flow index is currently above the zero line, indicating net capital inflows into Cardano. However, the index has begun to decline, suggesting that the inflows could begin to reverse in the near term.
Cardano price analysis: Conclusion
The Cardano price analysis shows that the virtual currency has a bullish trend and that resistance is present at $0.521 while support is found at $0.423. The 50-day moving average (MA) slows horizontally, indicating a possible consolidation phase, while the 200-day MA is still rising, which means that the long-term trend is still bullish. The Cardano price analysis suggests that ADA prices could retrace lower in the near term, but the long-term trend is still bullish.