
Bitcoin is currently showing signs of a potential recovery, as noted by crypto analysts, with a buy signal on the 12-hour chart via the TD Sequential indicator. The analysis covers Bitcoin’s market behavior from August 26 to August 30, 2024. Following a significant drop to $59,000 on August 27 from a high of $64,000, the market has entered a consolidation phase.
This period is characterized by minor gains and slight declines, as shown in green and red candlesticks that mark Bitcoin’s unstable trading range. The latest update on August 30 shows a small green arrow on Bitcoin’s chart, hinting at possible upward movement in the near future. Despite these fluctuations, Bitcoin remains below the $60,000 threshold, struggling to climb back to its recent peak.
In another analysis, crypto analyst Jelle has highlighted Bitcoin’s struggles near the $65,000 resistance level. According to his analysis of the daily chart, Bitcoin has consistently failed to surpass this barrier, marked by numerous rejections indicating a robust sell-off each time it nears this threshold.
Meanwhile, Bitcoin has found support around the $58,000 mark, bouncing back multiple times, underscoring the buyers’ lower-level presence. Over the past 24 hours, Bitcoin has seen a slight decrease in its price, at $59,493 at press time, marking a 1.45% drop. The cryptocurrency experienced fluctuations between a low of $58,707 and a high of $61,184 during this period. Despite today’s dip, Bitcoin’s price remains significantly volatile as it navigates challenging market conditions.
Bitcoin Plunges to $58K, Altcoins Decline Amid Market ChaosThis positioning suggests that Bitcoin is caught in a narrow range, with pivotal resistance and support levels that could dictate the market’s future direction. A clear break from these bounds may shape the next significant market trend.
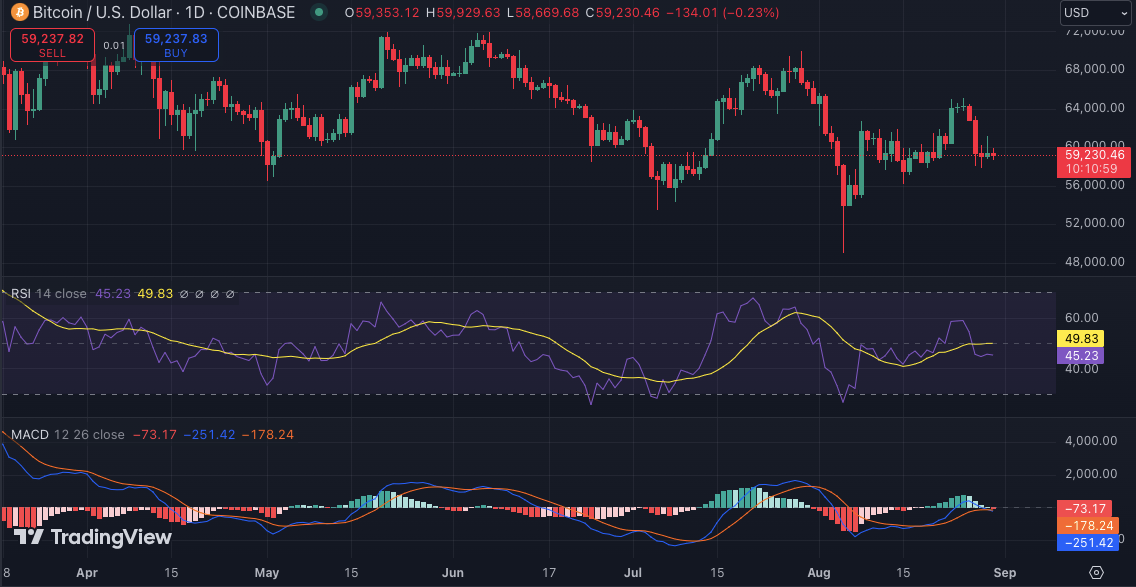
The 24-hour technical indicators for Bitcoin show mixed signals. The Relative Strength Index (RSI), currently at 45, suggests that Bitcoin is neither overbought nor oversold, indicating a balanced market sentiment. Meanwhile, the Moving Average Convergence Divergence (MACD) exhibits a bearish crossover, with the MACD line positioned below the signal line.